---
title: "Simple statistics for anomaly detection on time-series data"
excerpt: "Anomaly detection is a type of data analytics whose goal is detecting outliers or unusual patterns in a dataset."
authors: "Alberto Romeu"
categories: "I Built This!"
createdOn: "2023-09-25 00:00:00"
publishedOn: "2021-06-24 00:00:00"
updatedOn: "2025-04-24 00:00:00"
status: "published"
---

<p><strong>Anomaly detection</strong> is a type of data analytics whose goal is detecting outliers or unusual patterns in a dataset.</p><p>When working with time-series data (<em>time based network, systems or operational metrics</em>) having a mechanism to detect contextual anomalies is useful to take action on potential risks (<em>such a DDoS attack</em>), system failures and corrections (<em>like a sudden decrease in stock or sales</em>) or business opportunities (<em>such as an unexpected raise on a product’s sales</em>).</p><h2 id="z-score-to-the-rescue">Z-score to the rescue</h2><p>You can detect contextual anomalies in time-series applying simple statistics, such as <a href="https://en.wikipedia.org/wiki/Standard_score">Z-score</a>.</p>
<!--kg-card-begin: html-->
<blockquote>The Z-score measures how far a data point is away from the mean as a signed multiple of the standard deviation. Large absolute values of the Z-score suggest an anomaly.</blockquote>
<!--kg-card-end: html-->
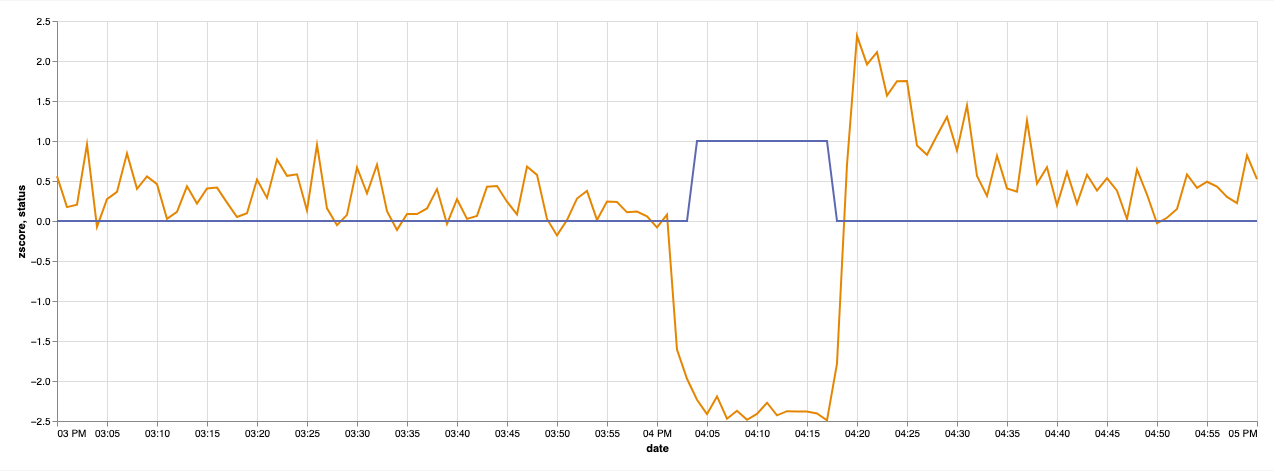
<p><code>zscore = (x - avg) / stddev</code></p><ul><li><code>x</code> is the current value of the data point you are evaluating</li><li><code>avg</code> is the mean of the population</li><li><code>stddev</code> is the standard deviation of the population</li></ul><h2 id="testing-a-z-score-based-algorithm-for-anomaly-detection">Testing a Z-score based algorithm for anomaly detection</h2><p>Let’s see an application of the Z-score for real-time anomaly detection:</p><figure class="kg-card kg-image-card"><img src="https://tinybird-blog.ghost.io/content/images/2023/09/6253d98ed361b166ab81cce4_anomaly-detection-01-11.png" class="kg-image" alt="" loading="lazy" width="1274" height="472" srcset="https://tinybird-blog.ghost.io/content/images/size/w600/2023/09/6253d98ed361b166ab81cce4_anomaly-detection-01-11.png 600w, https://tinybird-blog.ghost.io/content/images/size/w1000/2023/09/6253d98ed361b166ab81cce4_anomaly-detection-01-11.png 1000w, https://tinybird-blog.ghost.io/content/images/2023/09/6253d98ed361b166ab81cce4_anomaly-detection-01-11.png 1274w" sizes="(min-width: 720px) 720px"></figure><p>In the graph above, the x-axis represents time and the y-axis a quantity. We want to get notified when such kind of an anomaly takes place in the data, in this case an unusual decrease in the quantity.</p><p>First thing is choosing a data context:</p>
<!--kg-card-begin: html-->
<blockquote>In time-series, nearby data points tend to be more similar than far away data points.</blockquote>
<!--kg-card-end: html-->
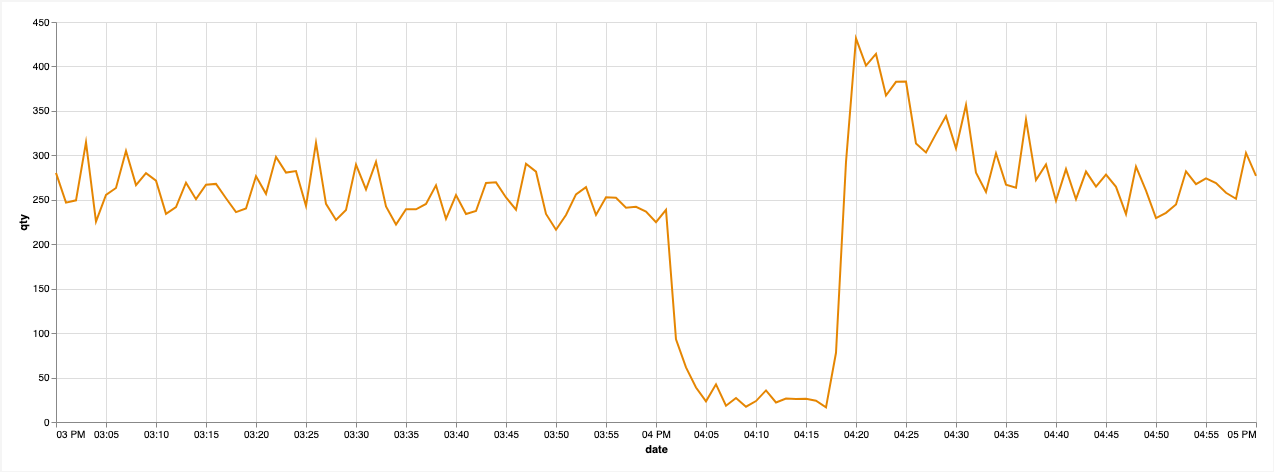
<p>That means most of the time the best context is last <code>n</code> minutes of data given a data point you want to evaluate. Or if you want to take into account seasonality, the same period of time for the previous day, month or year.</p><p>A very basic anomaly detection algorithm would be:</p><ul><li>Take 30 minutes of data prior to a given timestamp.</li><li>Remove outliers from the sample, and calculate the average and standard deviation of your metric (<em>you could use median based statistics as well</em>).</li><li>Calculate the Z-score for a series of data points, comparing to the context average and standard deviation.</li><li>To avoid locality in the anomalies, do some aggreggations. For instance, you can work in groups of ten seconds and consider an anomaly if the Z-score is beyond the threshold during a period of time.</li><li>Return ‘ok’ or ‘error’ depending on the Z-score value, a threshold of ±2 would work.</li></ul><figure class="kg-card kg-image-card"><img src="https://tinybird-blog.ghost.io/content/images/2023/09/62565366f20c695c0c1a6fb9_anomaly-detection-02-21.png" class="kg-image" alt="" loading="lazy" width="1274" height="471" srcset="https://tinybird-blog.ghost.io/content/images/size/w600/2023/09/62565366f20c695c0c1a6fb9_anomaly-detection-02-21.png 600w, https://tinybird-blog.ghost.io/content/images/size/w1000/2023/09/62565366f20c695c0c1a6fb9_anomaly-detection-02-21.png 1000w, https://tinybird-blog.ghost.io/content/images/2023/09/62565366f20c695c0c1a6fb9_anomaly-detection-02-21.png 1274w" sizes="(min-width: 720px) 720px"></figure><p>In the graph above, for any period in which the zscore is under -2 (<em>which is a value that makes sense statistically</em>) the anomaly status is 1 which means there’s a contextual anomaly, otherwise it’ll return 0.</p><p>You can find here an example of a Z-score based anomaly detection algorithm written in SQL.</p><h2 id="real-time-anomaly-detection">Real-time anomaly detection</h2><p>Anomaly detection systems are really valuable when you can react to unexpected events as they happen. You need a product that has at least these three features:</p><ul><li>Able to <strong>handle large production datasets</strong>, updated very frequently, ideally from an events stream (<em>think for instance in the volume of HTTP requests coming from a CDN provider</em>)</li><li><strong>Customizable</strong>: Even when you use an algorithm that can learn from itself, it’s sometimes required some domain knowledge to support corner cases, avoid false positives, etc.</li><li><strong>Easy to integrate</strong>: Anomaly detection is just one step of the process, but then you might need integrate to an alerting system, a visualization software to understand or explore the data, or some capabilities for actionable outputs.</li></ul><h2 id="caveats">Caveats</h2><p>Some caveats when manually building this kind of anomaly detection processes:</p><ul><li><strong>Normalize</strong> your data: quantities in the same units, dates in the same timezone, etc.</li><li>When talking about <strong>real-time</strong>, make sure everyone understands it as something that happened in the last 10 to 20 seconds.</li><li>Avoid <strong>false positives</strong> as much as possible. There’s nothing worse in an alerting system, than being notified from events that don’t require your attention.</li><li>Add context to your <strong>notifications</strong>: a graph snapshot of the time-series and data point that fired the alert, brief explanation on the reason, thresholds configured, actionable links or tools for further exploration, etc.</li></ul><h2 id="a-real-example">A real example</h2><p>One of Tinybird’s customers, a large retailer, wishes to be notified of sudden changes in their sales numbers. If something is preventing sales or causing sales to spike, they want to know about it immediately.</p><p>How we do it:</p><ul><li>We ingest all sales transactions in real-time using our Kafka Connector.</li><li>Since the transactions are in JSON, we extract and <a href="https://www.tinybird.co/docs/forward/get-data-in/local-file" rel="noreferrer">materialize</a> on ingestion all the values we need onto another Tinybird data source.</li><li>We write our anomaly detection logic in SQL in a <a href="https://gist.github.com/alrocar/a9137aa37e0ef0e8beb016c45ed3e536">Tinybird Pipe</a> that we expose as an <a href="https://blog.tinybird.co/2020/08/11/badass-api-endpoint/">API endpoint</a>.</li><li>We query the endpoint every X seconds: if we detect an anomaly, an alert is triggered (<em>in this case, a message in a Microsoft Teams chat</em>)</li></ul><p>Alerts of course is just one way to exploit real-time data. What’s interesting about doing this with Tinybird is that, once you have ingestion set up, you can do many more things with that data.</p><p>Those transactions can be used for real-time analysis, to build data products such as operational dashboards, to build analytics for end-consumers, to expose APIs for other areas of the organization and much more. Every new use case is just one SQL query away.</p>