---
title: "Measure deployment velocity with Vercel and Tinybird"
excerpt: "Learn how to use Vercel webhooks, Tinybird, and Next.js to build a simple app that tracks your deployment velocity."
authors: "Alasdair Brown"
categories: "I Built This!"
createdOn: "2025-01-10 00:00:00"
publishedOn: "2025-01-13 00:00:00"
updatedOn: "2026-04-24 00:00:00"
status: "published"
---

<p>Vercel is the web platform for software teams that ship fast. But how fast? And do we maintain that velocity over time?</p><p>Vercel webhooks allow you to push your data out of Vercel and do whatever you want with it. This works out of the box with Tinybird’s <a href="https://www.tinybird.co/docs/get-data-in/ingest-apis/events-api"><u>Events API</u></a>, meaning you can push all that Vercel data straight into the world’s fastest database in a few lines of code.</p><p>If you want to start from scratch and build your own insights based on your own Vercel webhook events, you can find here a <a href="https://www.tinybird.co/docs/get-data-in/guides/ingest-from-vercel"><u>step-by-step guide to send Vercel webhooks to Tinybird</u></a>.&nbsp;</p><p>But, in the words of <a href="https://www.youtube.com/watch?v=ziqD1xvSpF4"><u>daytime TV</u></a>, “Here’s one I made earlier”.</p>
<!--kg-card-begin: html-->
<div class="tip-box"><div class="tip-box-container"><div class="tip-box-title">Note</div><div class="tip-box-content">We're building an <a href="https://github.com/tinybirdco/dev-stack-analytics-template/tree/main">open source utility</a> for devs to analyze data from their entire stack - including tools like Vercel, Auth0, GitHub, Resend, Clerk, Stripe, and more - in one place. The demo here draws from The Dev Stack Analytics Template project.</div></div></div>
<!--kg-card-end: html-->
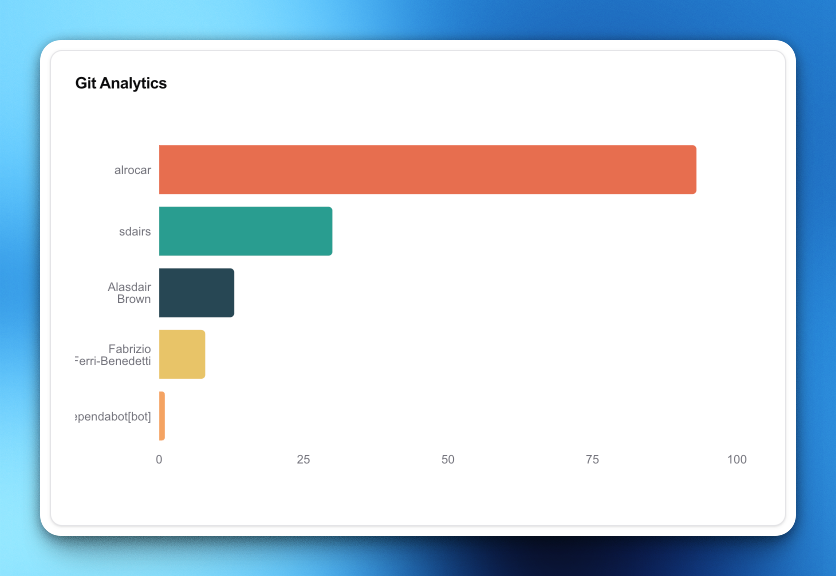
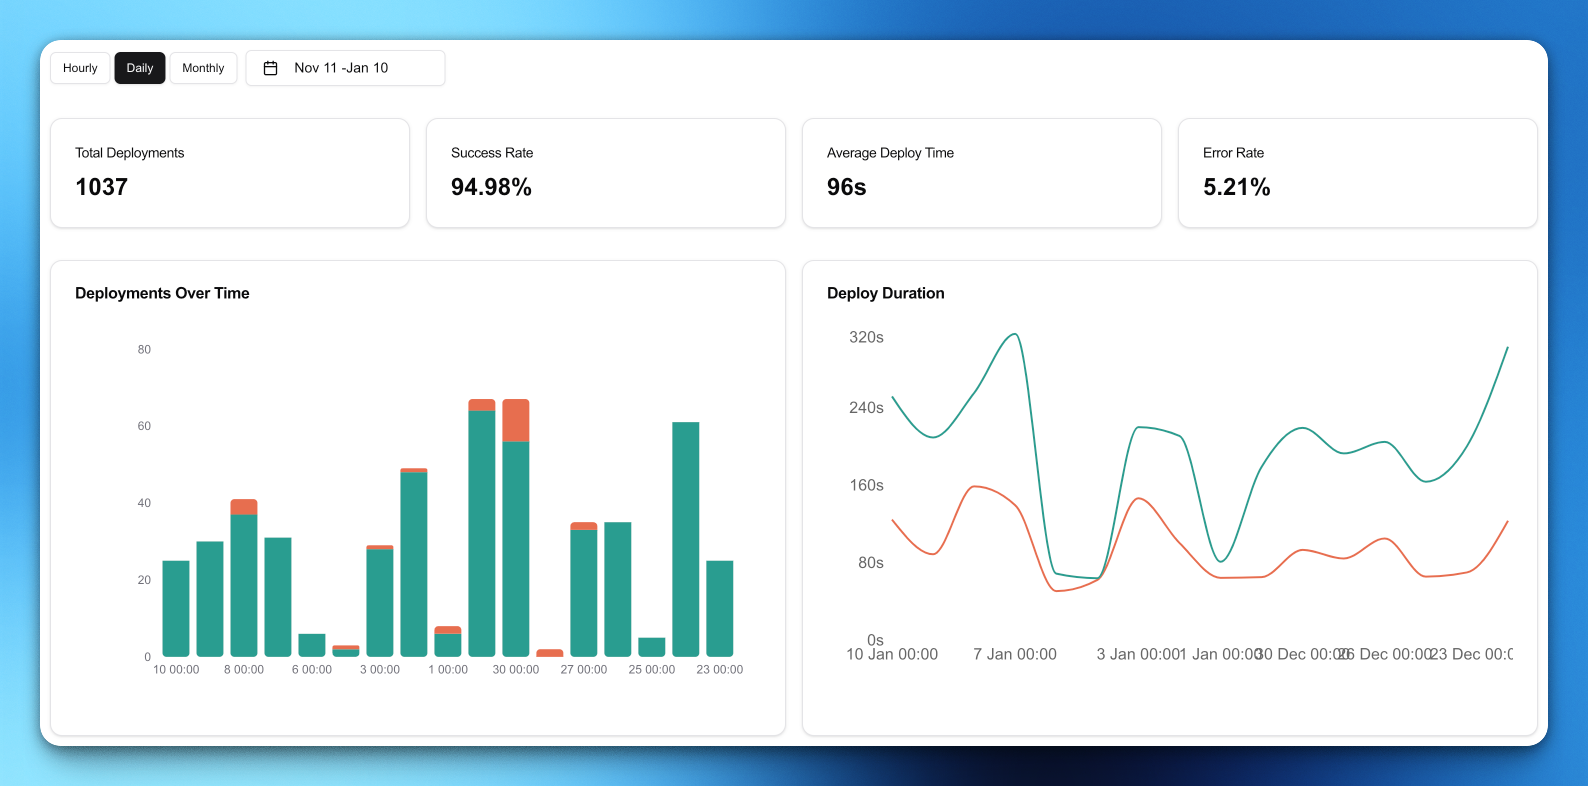
<h2 id="show-me-the-money-data">Show me the <s>money</s> data</h2><p>This dashboard (source <a href="https://github.com/tinybirdco/tinynest/tree/main/apps/web/src/components/tools/vercel"><u>here</u></a>) can immediately show us what's happening across our Vercel team. We can see how fast we’re making changes by the number of deployments over time, and how fast we can test and iterate by plotting our deployment durations.</p><figure class="kg-card kg-image-card kg-card-hascaption"><img src="https://lh7-rt.googleusercontent.com/docsz/AD_4nXcEyUf258gJIRYkqUaOhgueG_RB9BvzX1w0NIN-L5OoP2s0WWk82LiMnQBKGN5R7WBdJr4mWHYidGMaoCOafMXVkL4YR8XofL_Zdrlp3McLbrGrkVp-Dh-munYjNFi6qKcmxVXH?key=rDftpaFKT8oTa2ePjdfy2Sh-" class="kg-image" alt="A dashboard showing metrics for deployment velocity in Vercel" loading="lazy" width="1588" height="786"><figcaption><span style="white-space: pre-wrap;">I built these charts using Vercel webhooks, Tinybird, and a simple Next.js app.</span></figcaption></figure><p>To build this dashboard we have a stack like this:</p><ol><li>Vercel pushes data to the Tinybird Events API via webhooks.</li><li>We create some SQL transformations (Pipes) in Tinybird and publish them as API endpoints.</li><li>A Next.js app with shadcn/charts calls the Tinybird APIs and plots the data.</li></ol><p>As far as web app stacks go, it couldn't be much simpler.</p><h2 id="adding-a-new-chart">Adding a new chart</h2><p>To add a new chart, we only need to do two things:</p><ol><li>Write a new SQL query</li><li>Build the chart component</li></ol><p>Here’s what that looks like if I want to know who gets bragging rights as the fastest developer in the west.</p><p>Vercel’s webhook data looks something like this:</p>
<!--kg-card-begin: html-->
<iframe width="100%" src="https://snippets.tinybird.co/XQAAAALbAgAAAAAAAABBKUqGk9nLKw2aNi3vSL-YIXa64RkxZEUh-O2RMoSl-v0qn5Fy29Z8NgEIQ5mKJ1JI92O3fhwylFkyCBRWej7-ej15MMHSQEWsWyLxdD42Sw3AdRpPprfbGTKKYfou5jXy6fuLu-BPKo8zM81pQin1j-m1YLScywoksPR-Xp4QQlIFrvz9ZWgLMnbMfIS44S2t4Y9BSZoS6qeEANbteDtHDrSl0KbsX7rzDS4C7stBYUU3btTrkokPHeDB6X2NV2sadj1DgQ8zqlgDfmL5uzwJQrCUHAPqKHoFzrS1m7APR_jb6ATJbMSkswFLEccuZ9PoNadnamKMzB1ebC4y-Vnk9BZgRmP26vfsP00KO-ljx3H_R1Zl-UCe-1koBaJla3unk-qMv7jIhGs3i7GthEtqoE0cBvt8F5R3ZrOr_3StXAA/embed"></iframe>
<!--kg-card-end: html-->
<p>I’m interested in several things in this data:</p><ol><li>The user’s git login and name</li><li>The event type</li><li>The event time</li></ol><p>I want to count how many deployments each person is creating, so I can rank them. The query looks like this:</p>
<!--kg-card-begin: html-->
<iframe width="100%" src="https://snippets.tinybird.co/XQAAAAIXAgAAAAAAAABBKUqGk9nLKzhQAX1_q3NQ8CPRvTeWHQ9-BtE7Xc0qyxLYvdTJlX3L4ftT7hacoZdwBI5p2BSEDT2wARmKbC5bl9-Xg1rhRQx6m_xzCBm9wJi_UAKgpmOhhQLFW9EsbnZ7E4FJyFpbUOHbXpOk1Bd968MWFxPGZ-xUnUXuZbUpqaOyCRYqNjFn4-yF5-s8LHhXUG6S2KIsJgsXKevZntneG3G5_Uj5vPqHW8uYjP-WDsyEa2Lm26FvSVTeHhuLggKSYsvcKKfV16Fgbhd90eVruH69ZbBQEIchIzBdwKl8PdZaPrGO6ifiQjH_Wgci7zE9YLp3Nyy-dSdKxuZyuBaWhlpkK8Wq9X8dU2RMFuqtoGHmBRgJWScQOYmJQjRTJedpmRUCbB_awcZc44jidfJbe_UysMCNRcisT08bv27jqWUWtw8EwCV4Kc956cGueIzJx2Zh-jt43w/embed"></iframe>
<!--kg-card-end: html-->
<p>Pushing that query to Tinybird, I get an API that returns a result like this:</p>
<!--kg-card-begin: html-->
<iframe width="100%" src="https://snippets.tinybird.co/XQAAAAIpAgAAAAAAAABBKUqGk9nLKv3Z4xLzIuBeA-idh2B2cZwsz6NT3dx2xUzVWtkdClc8Nf9UgUaOpKI44mg6sjh2_vB_rx2WoSxSiCpdqeHuYxXz3wMr4pF_0gh0zZ4PadgWGdMYP6iH6_SSEi5pJj8sjWcitpkOCJ82KS6UTJjajEz8-UPnGtADQyjPuadLXeRUnvp1utSmPW5_vvpnIneTCgSBdb2AJKZYo8M4xb0mHP1fXlpnT2fOxtcHZomSXHHg3jAmqlUsWcckVyQuLxES3O8-IlXOo6bkOV-AUHIb1lKbEbD7Vc39ww62/embed"></iframe>
<!--kg-card-end: html-->
<p>Just a quick <code>fetch()</code> to pull the data:</p>
<!--kg-card-begin: html-->
<iframe width="100%" src="https://snippets.tinybird.co/XQAAAALYAQAAAAAAAABBKUqGk9nLKwEGx2i5w87M5D53qK2UFiUjXf9WHej_HTNYHCmc2kOtp75ioGYxLhc2DToJ4ouEg4gPbyhtbsKyYavK5xyZxH7YoWOXrf53P6zmJvL_vT-5UTgb5mKL5MHU798bS9OgxTEW8oafclaWg_ZQC21d7EjaJy3n4sl-nr9rWMhvS6vhSo9KF2u5PRcNxeyOqIUEJAoiyHoEvBdXLguV0XN0p_HqRP_k95XZdKp4yU12lfvIWhHnEXnIdJ_Emnb982eIBzIWwp8qhFDRHEOtCxBlwXPmMo0Wo743_QRTuc78xNthS9fXJYPu1M1AG1pFlvR0RJ4-juse-4ueTMSvKq2dFGFG9VO9HLROrvUg9JiRGUYdzeBpNB5xn6-oWDFXoU_RtvnLSqgCFMRbvdQXUCk1D2Ij9F917Xgx0jbU_NzcJuBJS_Qd3S3qP__b7mrP/embed"></iframe>
<!--kg-card-end: html-->
<p>And via the magic of <a href="https://ui.shadcn.com/charts"><u>shadcn/charts</u></a>, I can plot this data with little more than copy and paste</p><figure class="kg-card kg-image-card kg-card-hascaption"><img src="https://lh7-rt.googleusercontent.com/docsz/AD_4nXe_cU2Gkm49Bs-SHuKVYHUQ17mzJKYmXy_KmNIwXKeu49-tT15k3e0Fq2x0W7KTiqs5xfT0yEYy584mWJoV9JsoyQW_nDF7ulhXFCnurKxIyTgZaX7G27hh2XIwcfO0cMhka2TEHQ?key=rDftpaFKT8oTa2ePjdfy2Sh-" class="kg-image" alt="A shadcn component showing top contributors to Vercel projects" loading="lazy" width="836" height="576"><figcaption><span style="white-space: pre-wrap;">I used shadcn chart components to visualize the response from my Tinybird endpoint</span></figcaption></figure><h2 id="but-what-else">But what else?</h2><p>Vercel exposes many <a href="https://vercel.com/docs/observability/webhooks-overview/webhooks-api#supported-event-types"><u>event types</u></a> that we could use to further analyze this data, so what else could we do?</p><p>The only thing better than going fast is going faster, right?</p><p>We could plot <a href="https://vercel.com/docs/observability/webhooks-overview/webhooks-api#deployment.error" rel="noreferrer"><code>deployment.error</code></a> events over time to correlate the impact of errors against deployments and see how increasing error rates impact our shipping speed. </p><p>Or we could enrich deployment errors with deployment logs, find the most common errors, and eliminate them to improve deployment consistency overall.&nbsp;</p><p>Once the data lands in Tinybird, exploring and productizing these ideas takes just minutes.</p><p><a href="https://www.tinybird.co/signup" rel="noreferrer">Give it a go</a>. If you need help, pop into our <a href="https://www.tinybird.co/community" rel="noreferrer">Slack Community</a> and ask away.</p>