Consume API Endpoints in Grafana
Easy
With Grafana you can create, explore, and share flexible dashboards over the data you expose in the API Endpoints you create with Tinybird thanks to the JSON API plugin.
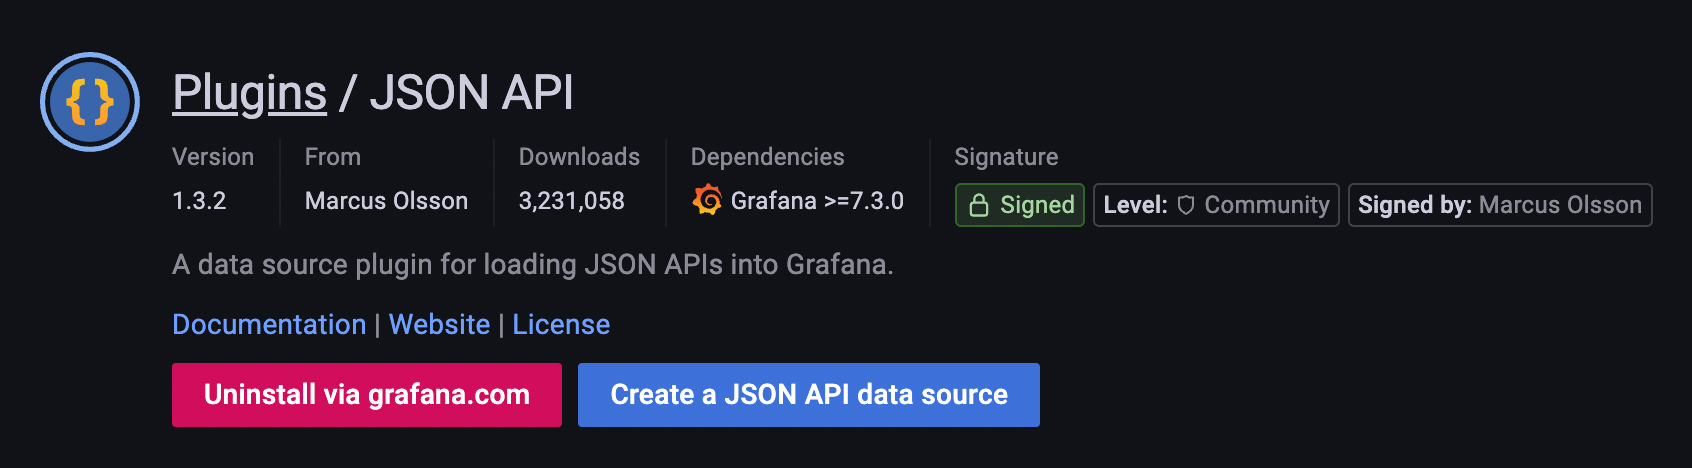
Install the JSON API plugin
Follow the steps in https://grafana.com/grafana/plugins/marcusolsson-json-datasource/?tab=installation.
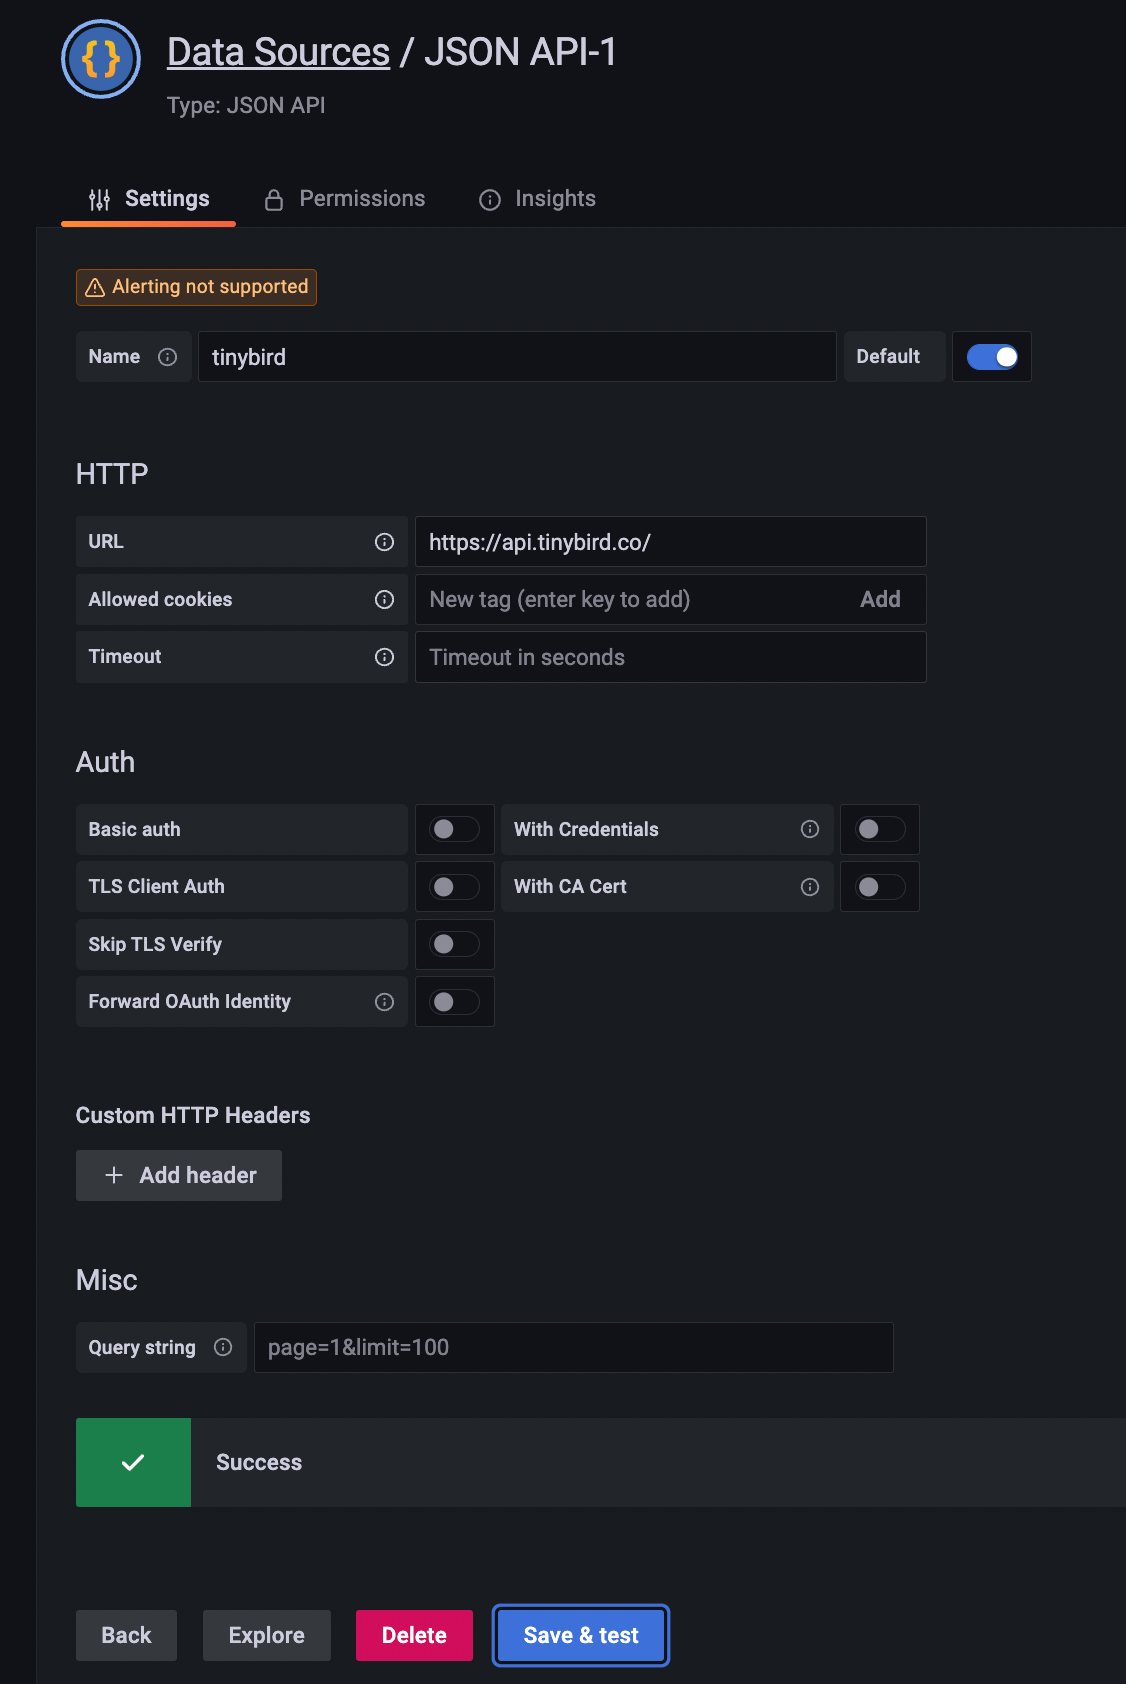
Create a Grafana Data Source
Create a new Data Source with the plugin. Fill https://api.tinybird.co/ —or the URL where your Tinybird Workspace is hosted— in the HTTP URL field.
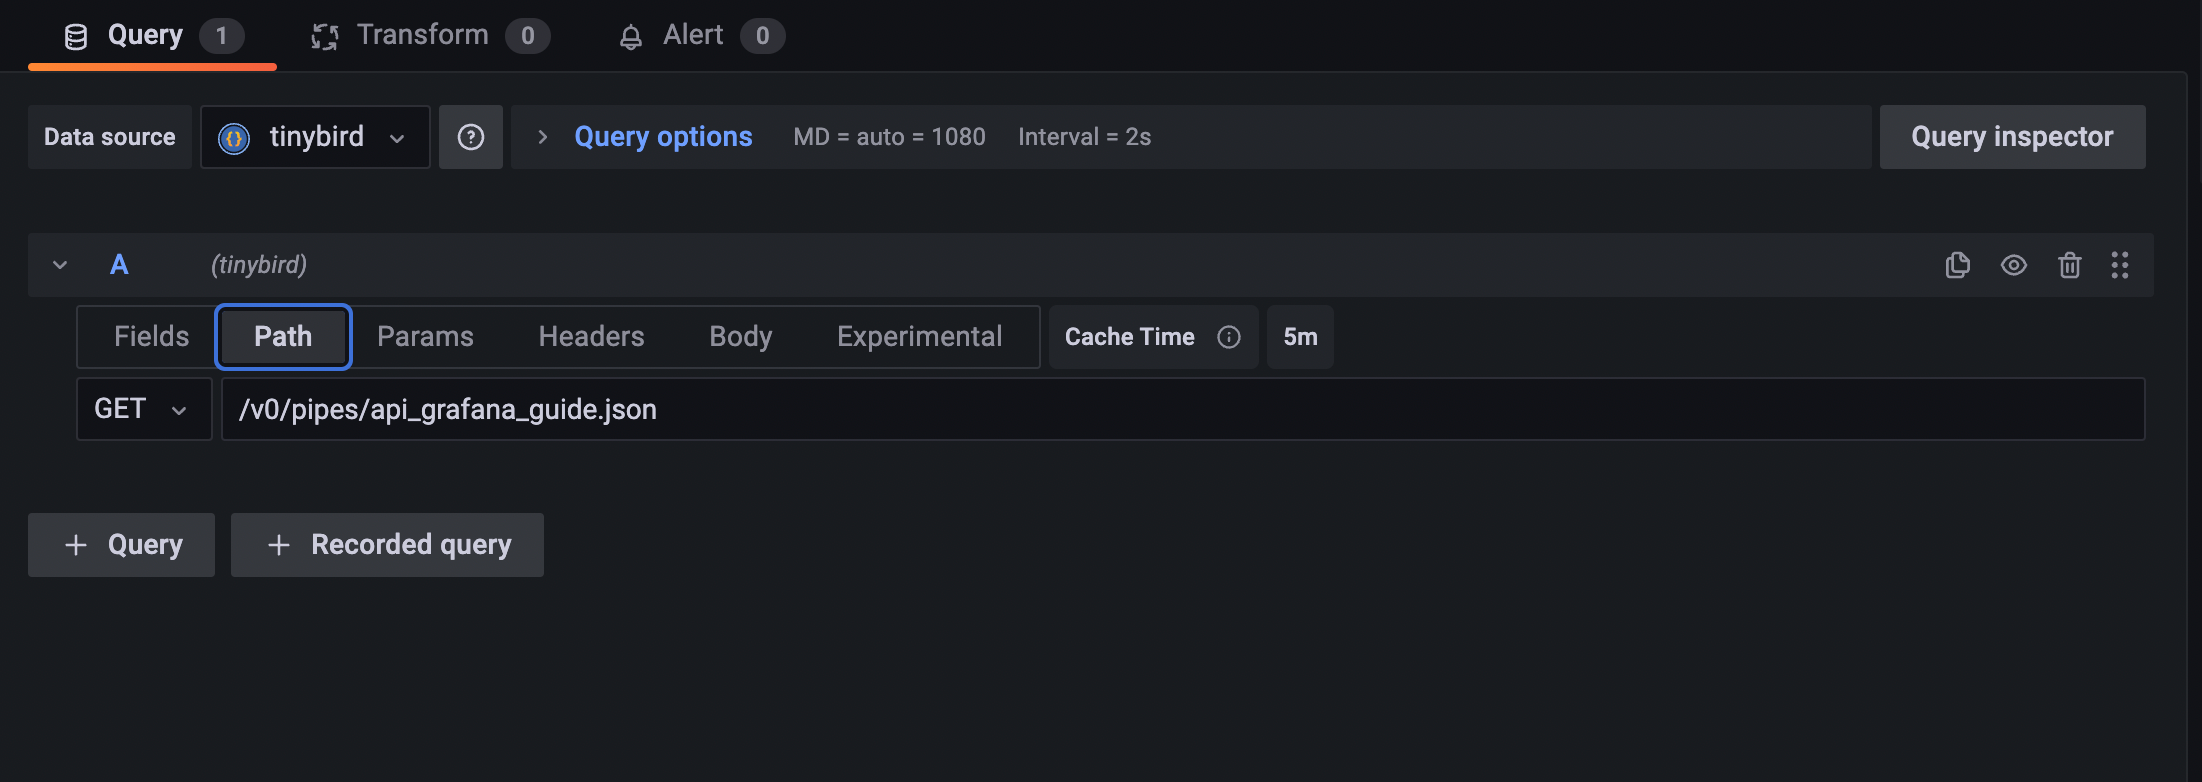
Edit the Query
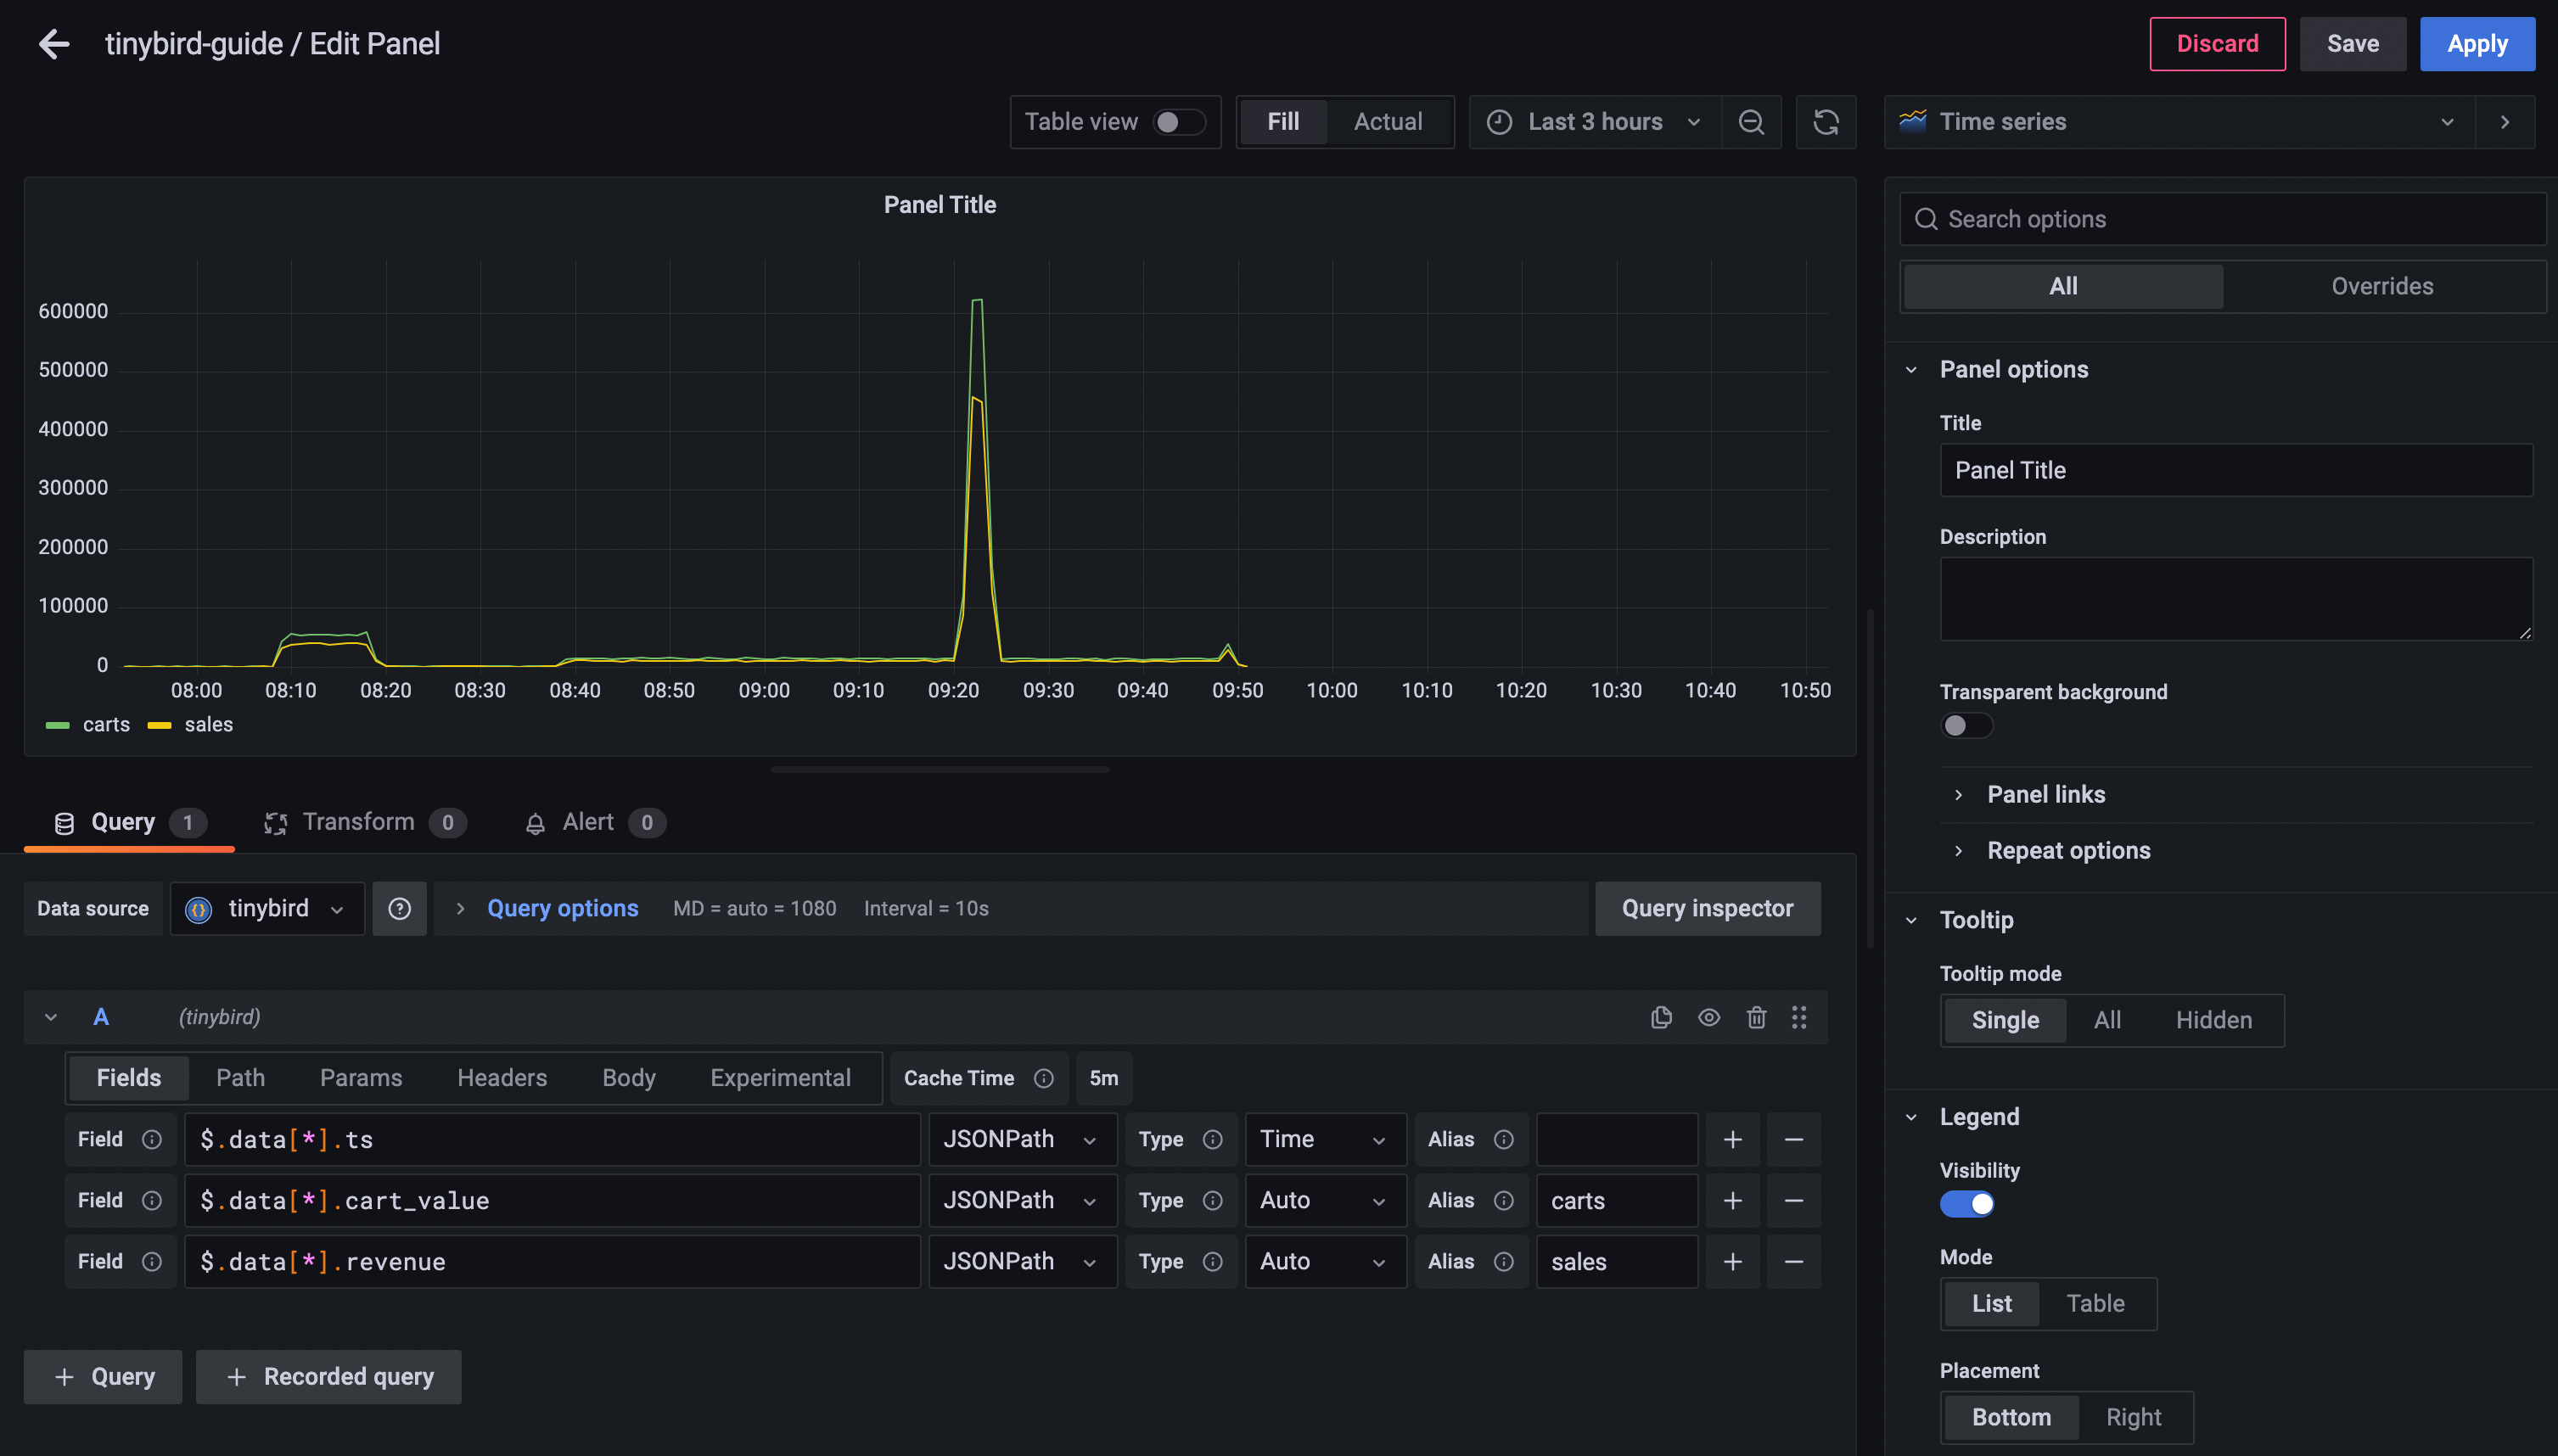
Create a new Dashboard, edit the suggested Panel, and use the Data Source you just created.
We will consume the endpoint shown in this documentation page.
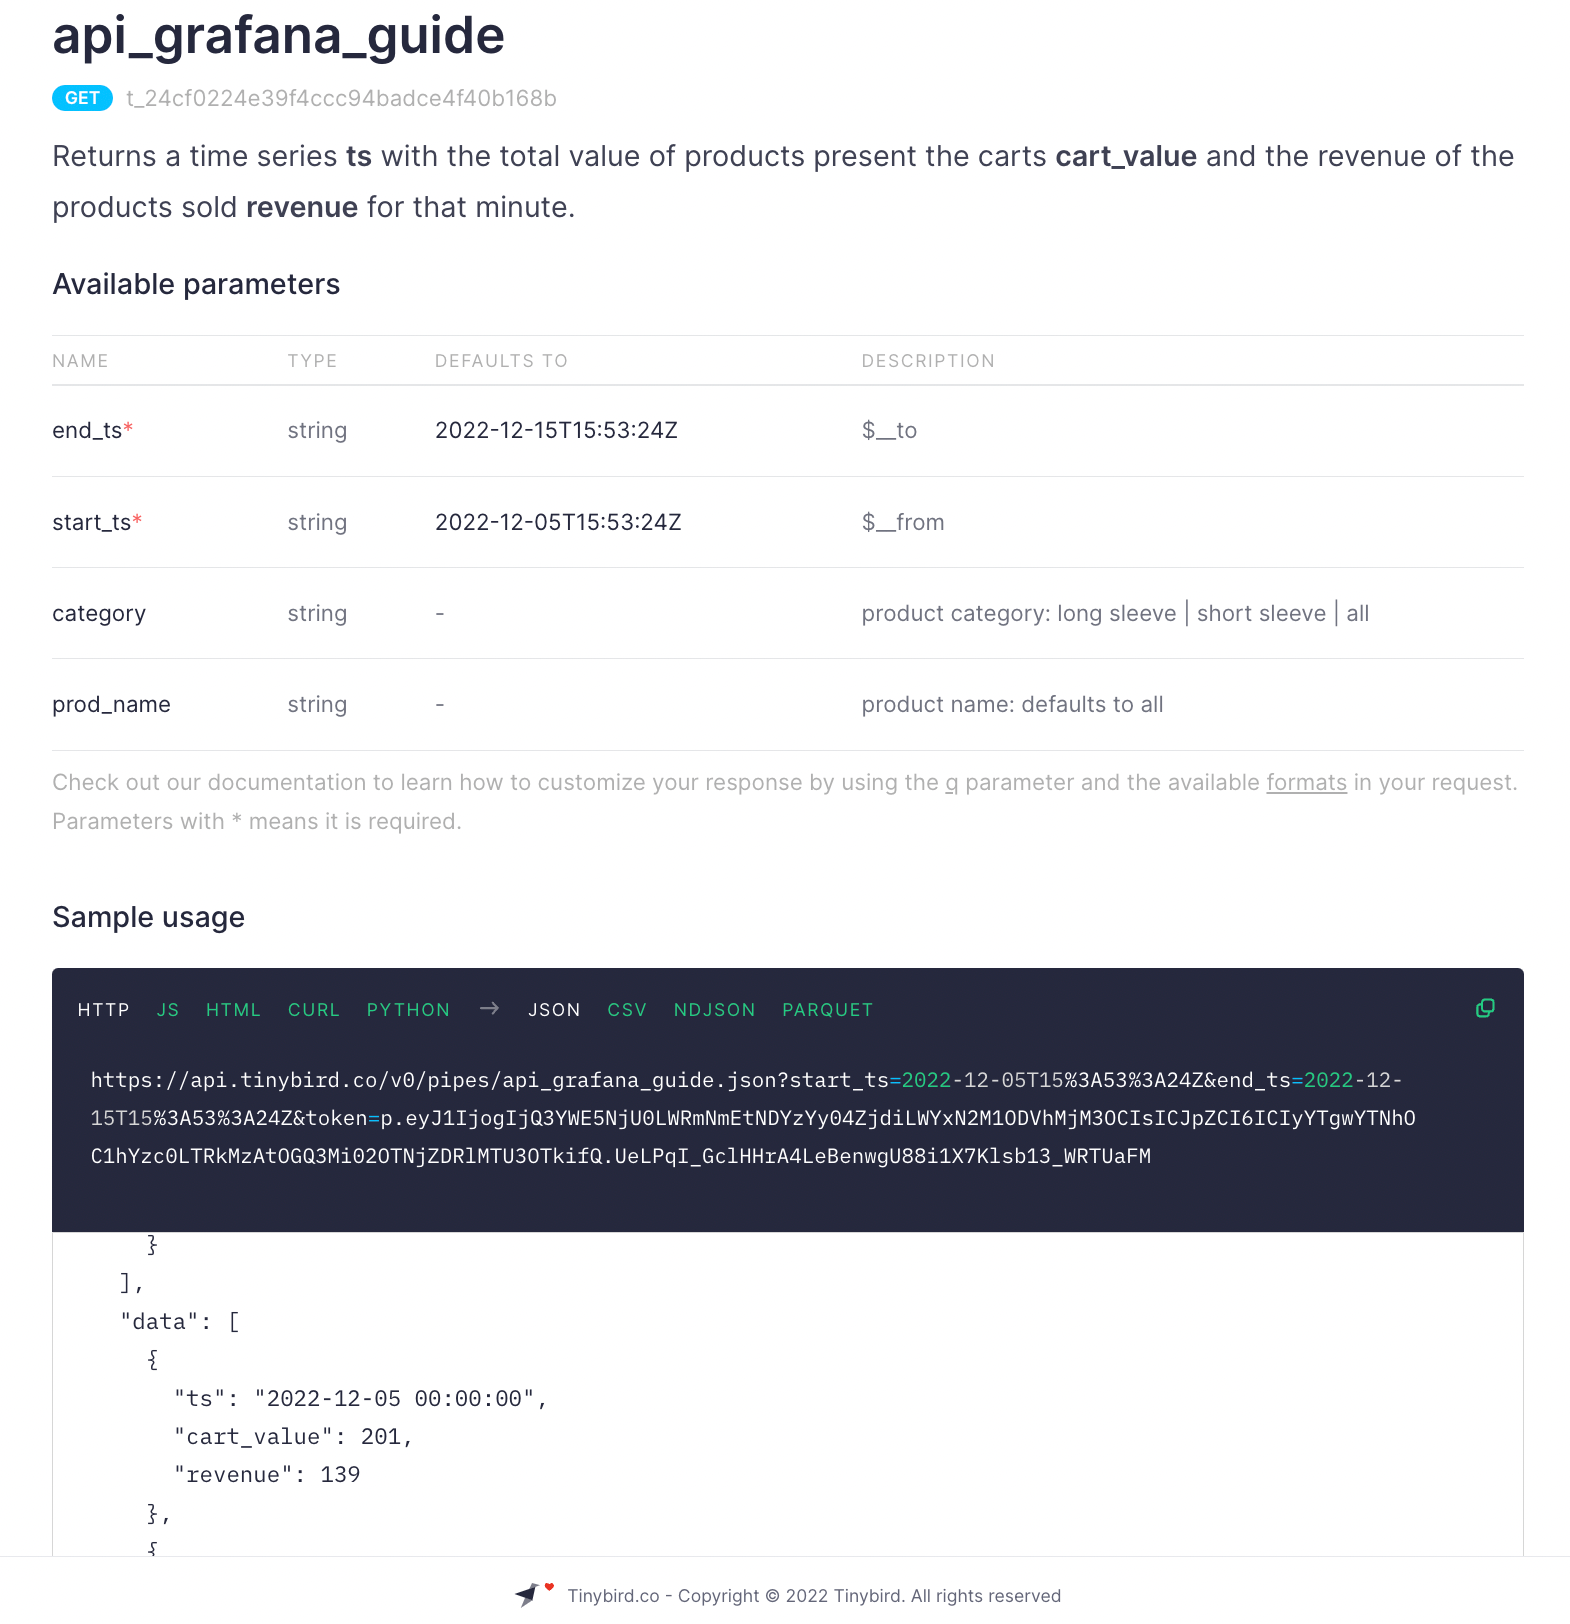
So, the Path in the Query editor is /v0/pipes/api_grafana_guide.json.
We need to add the mandatory Params: token, start_ts, and end_ts.
You can use Grafana's global variables $__from and $__to defined with the time range selector.
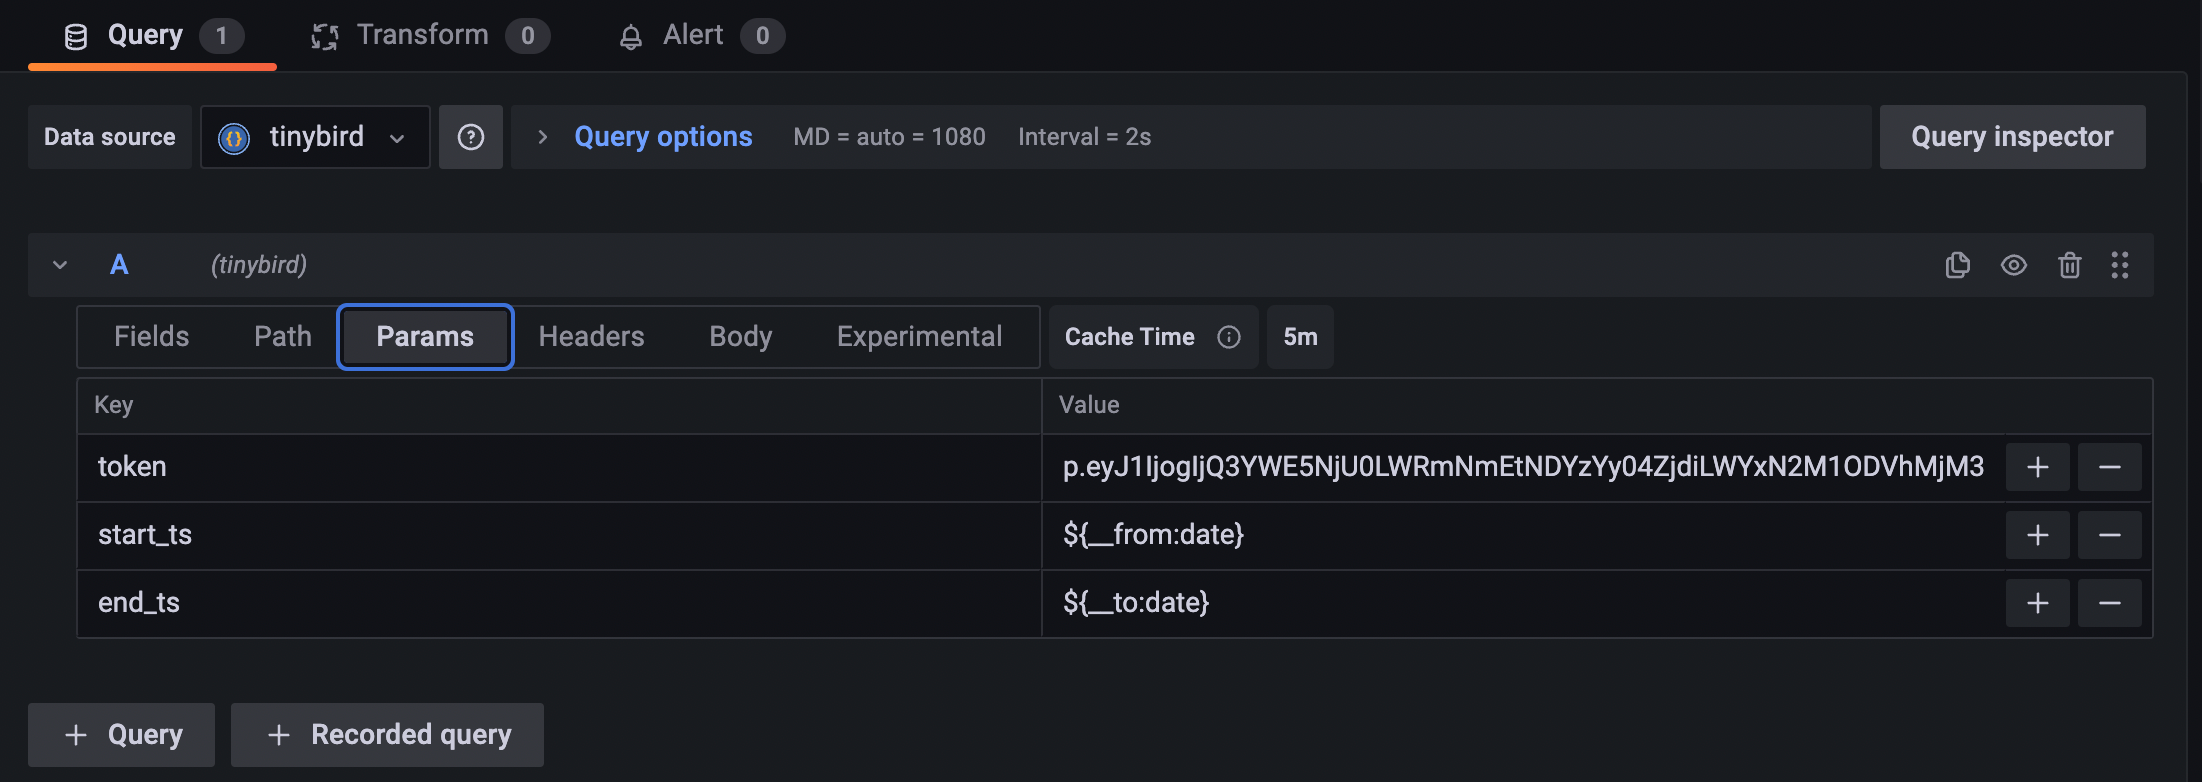
Note we are using the following format ${__from:date} and they can be converted to DateTime in your nodes with parseDateTimeBestEffort().
WHERE
   ts BETWEEN parseDateTimeBestEffort({{String(start_ts)}})
   AND parseDateTimeBestEffort({{String(end_ts)}})
Lastly, let's extract the information from the respose Fields using the JSONPaths.
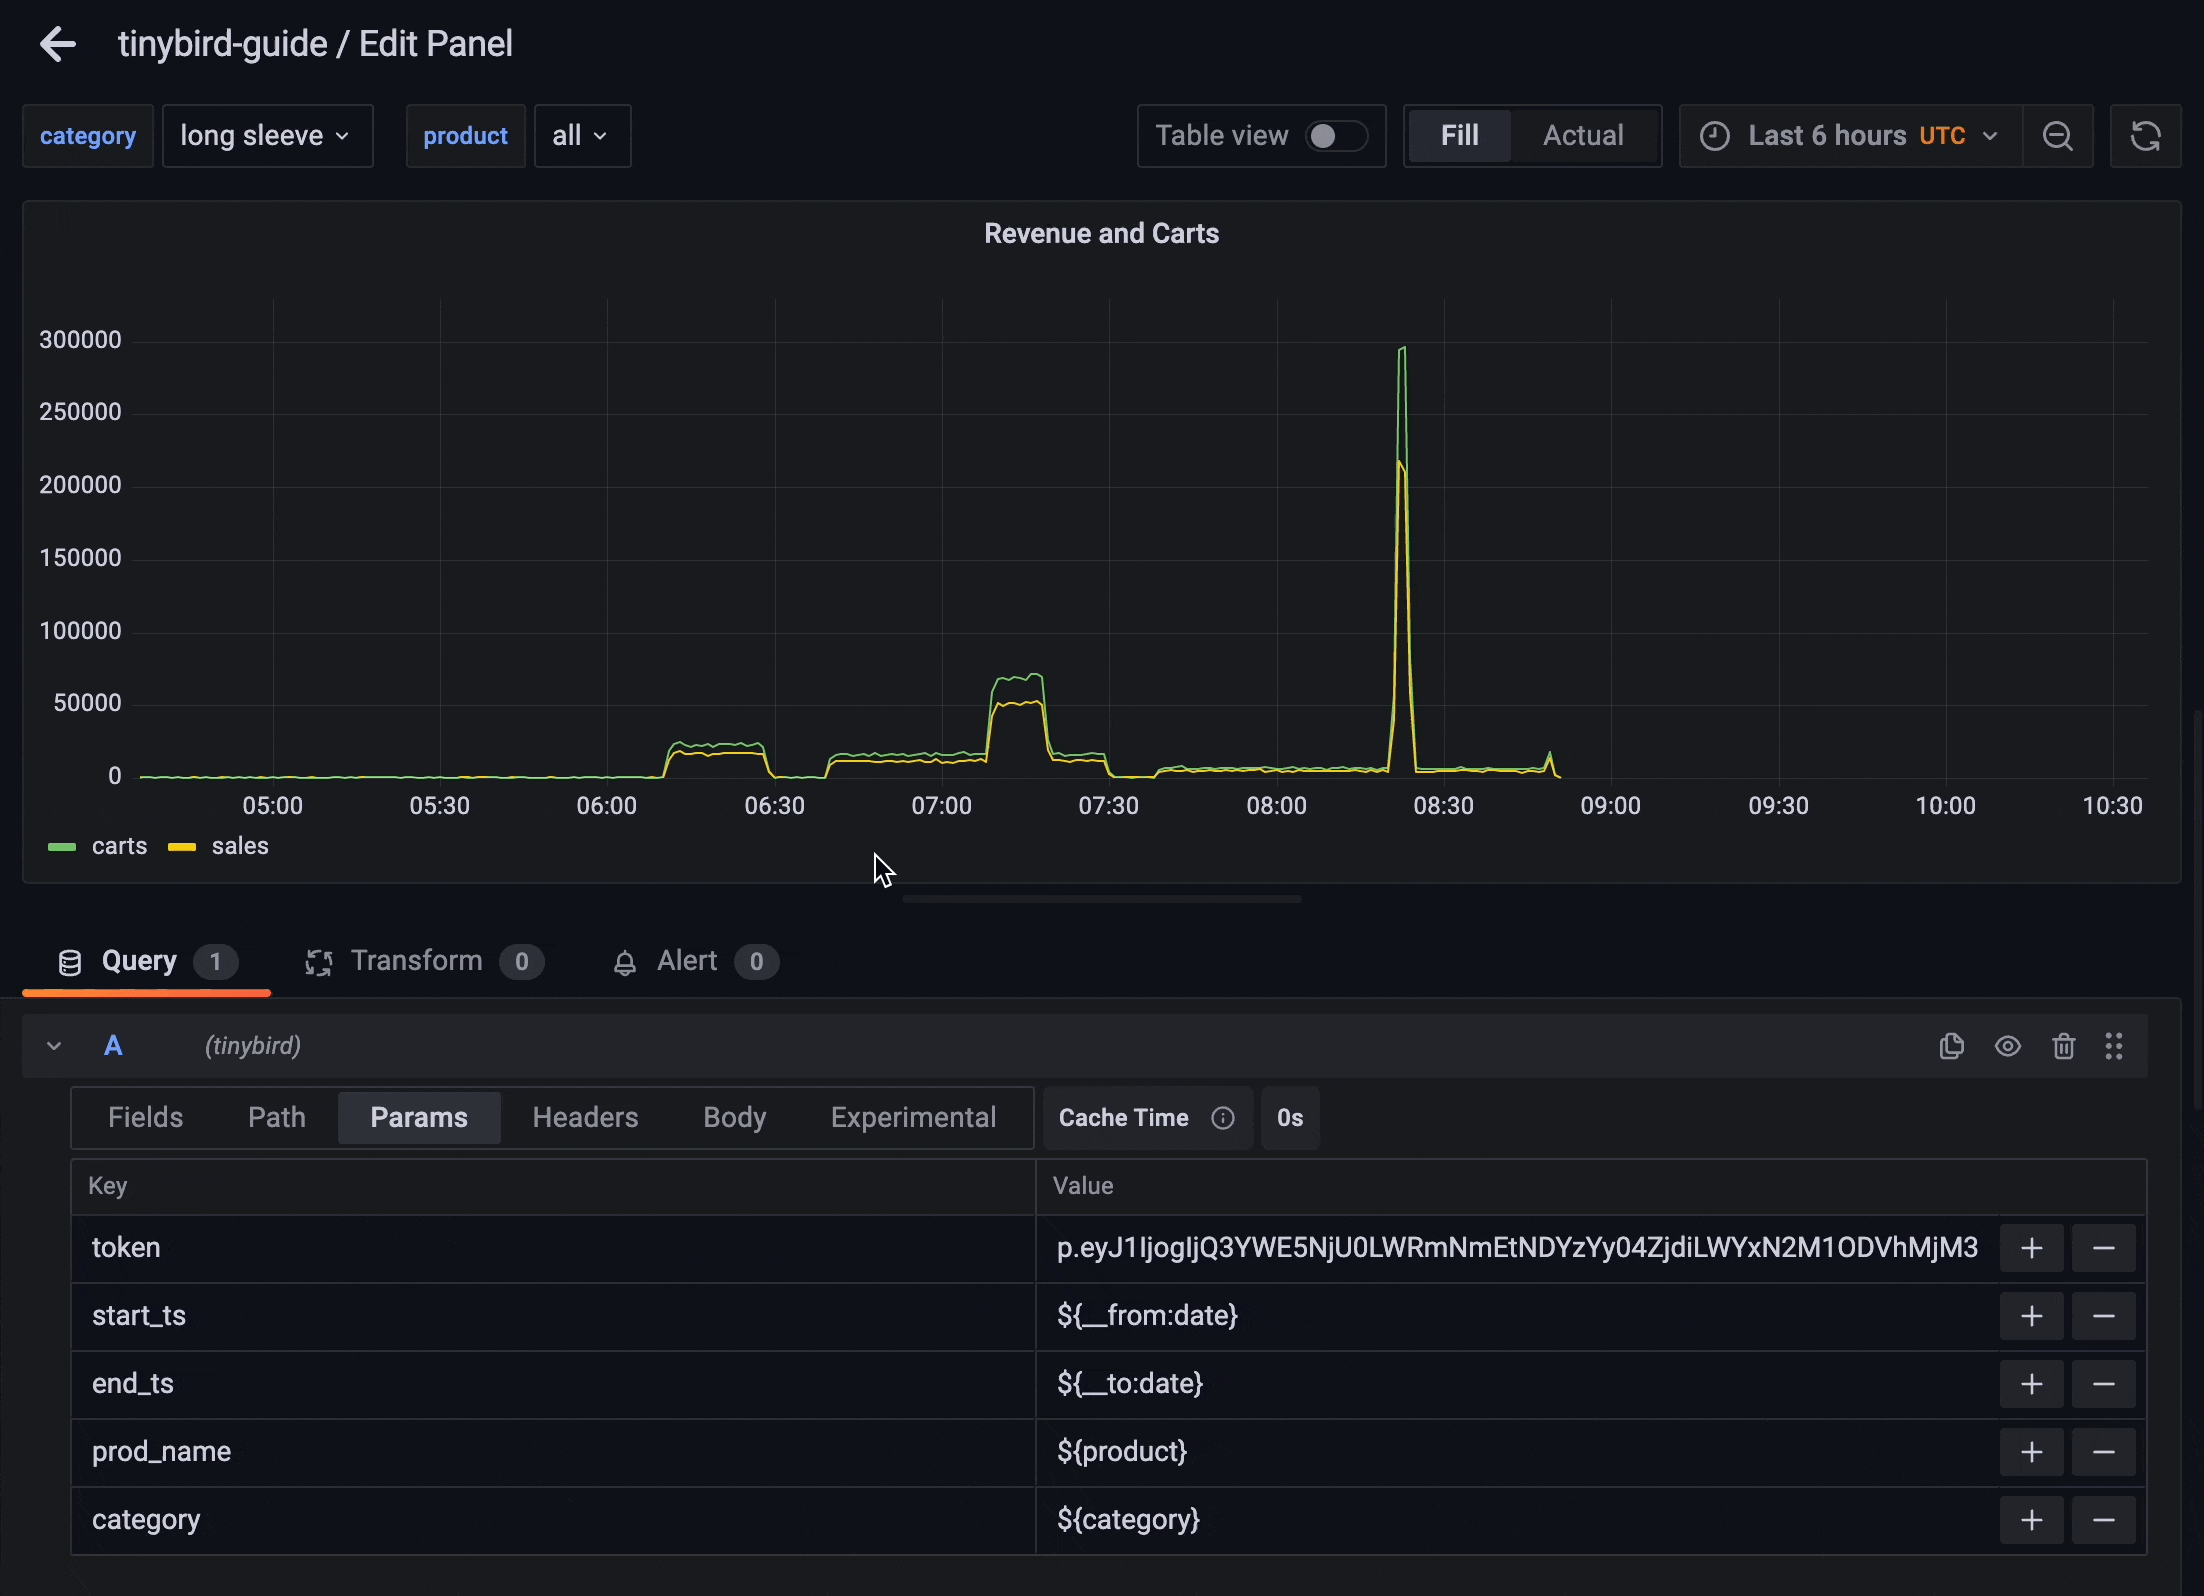
Dashboard Variables
You can also query Tinybird endpoints to define Dashboard Variables
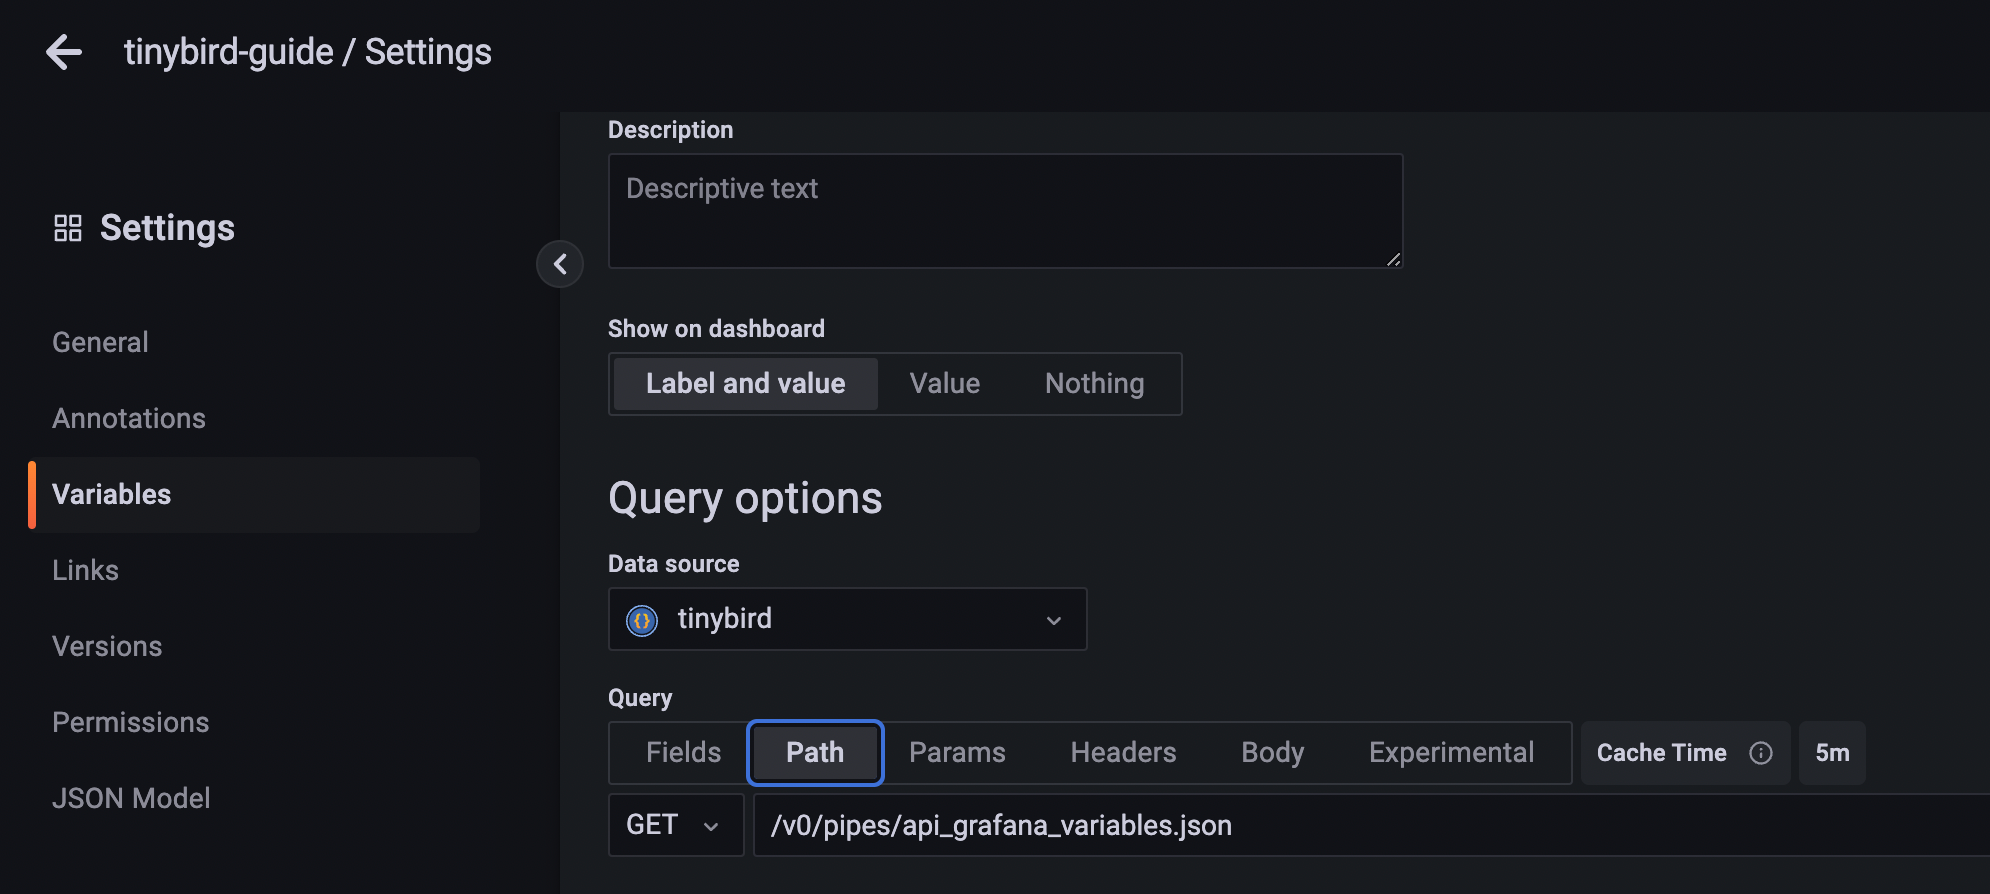
That will make it interactive
Final notes
More details on how to deal with Query editor and Variables in the plugin documentation
Although we love JSON API plugin, we noticed it doesn't support alerting. If alerts are requirement, you might want to check Infinity plugin, that works in a very similar way.