Best practices for Materialized Views
Read on to learn how Materialized Views work and how to best use them in your data projects.
How data gets into a Materialized View
Tinybird ingests data into Materialized Views in blocks. This process is presented in the following diagram. Every time new data is ingested into the origin Data Source, the materialization process is triggered, which applies the transformation Pipe over the data ingested and saves the output of that Pipe, which is a partial result, in the Materialized View.
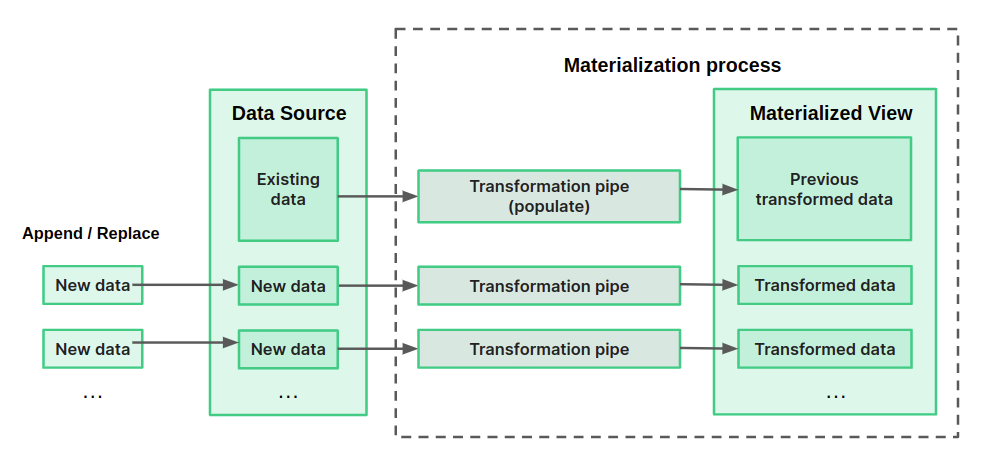
Data that was present in the origin Data Source prior to the Materialized View creation is inserted into the destination Materialized View through a populate operation.
Regular materializaton
Materialized Views in Tinybird are incremental and triggered upon ingestion. From the moment it's created, the new rows are inserted in the Materialized View. If an insert is too big, it's processed in blocks.
Because materializations are performed only over the new data being ingested, and not over the whole data source, avoid using the following operations: Window functions, ORDER BY, Neighbor, and DISTINCT.
Populates
Populates move historical data from the origin Data Source into the Materialized View. There are two types: complete and partial.
If you're populating from a Data Source with hundreds of millions of rows and doing complex transformations, you might face memory errors. In this type of situation, use partial populates.
If you're using the CLI, populates are triggered using tb pipe populate. You can add conditions using the --sql-condition flag, for example, --sql-condition='date == toYYYYMM(now())'. If your sql_condition includes any column present in the Data Source engine_sorting_key, the populate job should process less data.
If you have constant ingest in your origin Data Source, see Populates and streaming ingest.
Aggregated Materialized Views
Sometimes a background process in Tinybird merges partial results saved in intermediate states during the ingestion process, compacting the results and reducing the number of rows. The following diagram illustrates this process in more detail through a simple example.
Let's say an eCommerce store wants to materialize the count of units sold by product. It's ingesting a JSON object every minute, with a product represented by a capital letter and the quantity sold during the last minute.
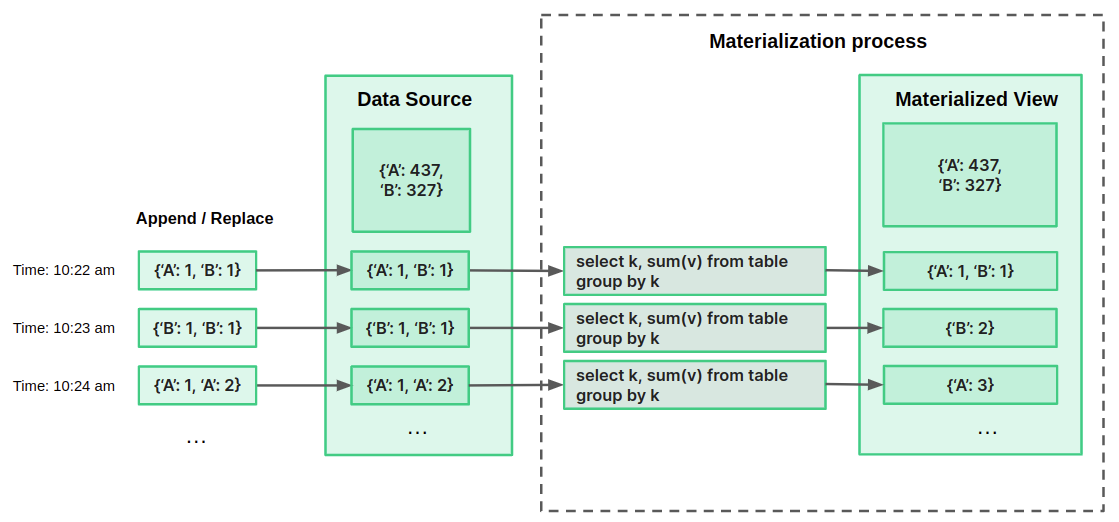
The store could define in their Pipe some simple SQL to sum the count of units sold per minute as data is ingested. The Pipe is applied over each new block of appended data, and the output is immediately saved in intermediate states into the Materialized View. Every 8 or 10 minutes, the background process merges the intermediate states, completing the aggregation across the entire Data Source.
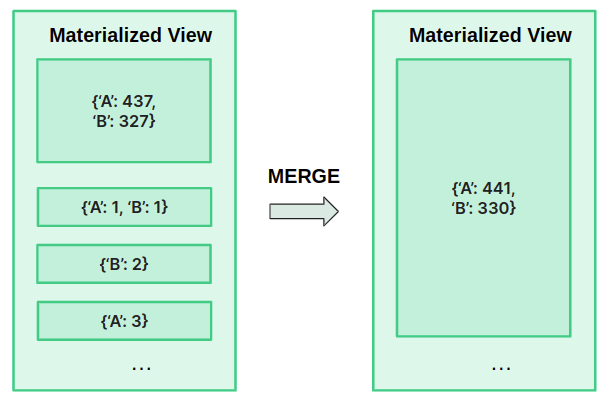
Because they're working in real time, the store can't always wait for this background process to take place. When querying the Materialized View, they should use the proper merge combinator and GROUP BY clause in the query itself.
Understanding State and Merge combinators for Aggregates
Tracking when the background process that merges aggregate results in a Materialized View has occurred isn't always practical. Because of this, you need to store intermediate states using the -State suffix. If you're creating a Materialized View using the UI, this is done automatically.
Here's an example of using -State when defining the transformation Pipe to calculate these intermediate states:
NODE Avg calculation
SQL >
SELECT
  day,
  city,
  avgState() avg
FROM table
GROUP BY day, city
You also need to specifically define the appropriate schema for the Materialized View:
SCHEMA >
  day Date,
  city String,
  avg AggregateFunction(avg, Float64)

ENGINE_SORTING_KEY date, city
Finally, you need to retrieve the data using the -Merge suffix in your API Endpoint node to make sure the merge process is completed for all data in the Materialized View:
NODE endpoint
SQL >
%
SELECT
  day,
  city,
  avgMerge(avg) as avg
FROM avg_table
WHERE day > {{Date(start_date)}}
GROUP BY day, city
Understanding the Materialized View parameters
When you create a Materialized View in the UI, Tinybird automatically recommends the best parameters for most use cases. This is useful to understand parameters for more complex use cases.
Sorting Key
The Sorting Key defines how data is sorted and is critical for great performance when filtering. Choose the order of your sorting keys depending on how you're going to query them. Here are a few examples for a simple Materialized View containing day, city, and avg columns:
- You want to query the average for all cities on a particular day: the
daycolumn should be the first sorting key. - You wanted the average over the last month for a particular city: the
citycolumn should be the first sorting key.
For Materialized Views containing aggregations, every column in the GROUP BY statement has to be in the sorting keys, and only those columns can be sorting keys.
For non-aggregated Materialized Views, you can select other columns if they fit better for your use case, but don't recommend adding too many: you get only a negligible performance boost after the fourth sorting key column.
Partition by
Partitions do not improve query performance. Use ENGINE_SORTING_KEY for query optimization. Usually you don't need a partition key, or a partition by month (toYYYYMM(date_column)) or year (toYear(date_column)) is enough. Overly granular partition keys severely degrade write performance.
Tinybird guesses the best partition key if your materialization query has a Date or DateTime column. If there aren't any Date columns, Tinybird doesn't set a partition key. Having no partition is better than having the wrong partition. If you're comfortable with partitions and want to use a custom partition, only use monthly or yearly time-based partitions. See MergeTree engine for details.
Time To Live (TTL)
If you have certain lifetime requirements on the data in your Materialized Views, you can specify a Time To Live (TTL) parameter when creating a Materialized View.
An example of TTL requirement is satisfying GDPR regulations. TTLs can also be useful if you only intend to query a brief history of the data. For example, if you always and only query for data from within the last week, you can set a TTL of 7 days. When a TTL is set, all rows older than the TTL are removed from the Materialized View.
Advanced tab (UI)
Most of the time, the defaults recommended by Tinybird are the best parameters to use. Occasionally, however, you might need to tweak these parameters. For this, you can use the Advanced tab in Tinybird, where you can write code that's passed to the View creation.
Populates and streaming ingest
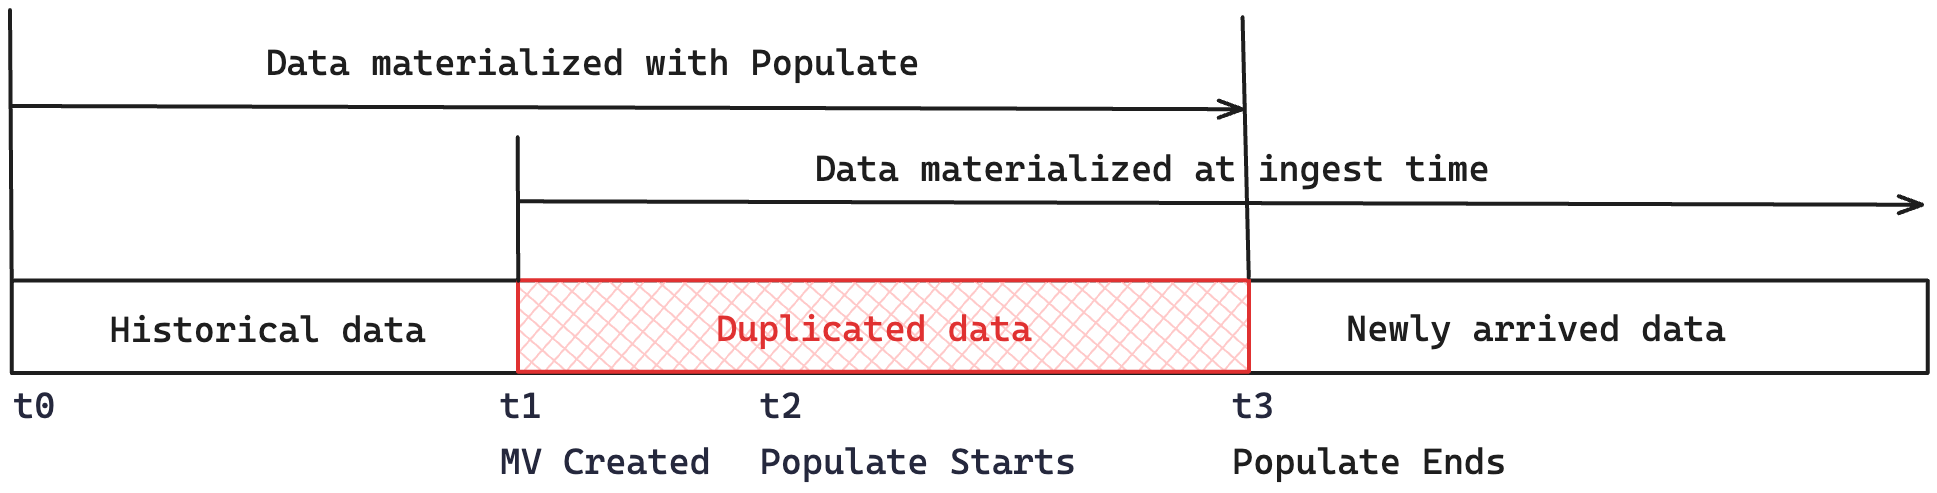
A populate is the operation of moving data that was present in the origin Data Source before the creation of the Materialized View.
The following diagram illustrates the process. At t1, the Materialized View is created, so new rows arriving in the origin Data Source are processed into the Materialized View. To move the data from t0 to t1, launch a populate, either manually or when defining the Materialized View, at time t2.
All that data that arrives between t1 and t2 might be materialized twice: once due to the regular materialization process, at ingest time, and the other one due to the populate process.
When you don't have streaming ingest in the origin Data Source, it's usually a safe operation, as long as no new data arrives while the populate is running.
Backfill strategies
Consider one of the following strategies for backfilling data.
Two Materialized View Pipes
Use a timestamp in the near future to split real-time ingest and backfill.
Create the regular MV with a WHERE clause specifying that materialized data is newer than a certain timestamp in the future. For example, WHERE timestamp >= '2024-01-31 00:00:00':
NODE node
SQL >
   %
   SELECT (...)
   FROM origin_ds
   WHERE timestamp >= '2024-01-31 00:00:00'

TYPE Materialized
TARGET_DATASOURCE mv
Wait until the desired timestamp has passed, and create a the backfill Materialized View Pipe with a WHERE clause for data before the specified timestamp. No new data is processed, as the condition can't be met.
NODE node
SQL >
   %
   SELECT (...)
   FROM origin_ds
   WHERE timestamp < '2024-01-31 00:00:00'

TYPE Materialized
TARGET_DATASOURCE mv
Finally, because it's now safe, run the --populate command.
Use Copy Pipes
Depending on the transformations, Copy Pipes can substitute the populate for historical data. See Backfill strategies.
These tips only apply for streaming ingest. With batch ingest, or being able to pause ingest, populates are totally safe.
Use the same alias in SELECT and GROUP BY
If you use an alias in the SELECT clause, you must reuse the same alias in the GROUP BY.
Take the following query as an example:
SELECT
    key,
    multiIf(value = 0, 'isZero', 'isNotZero') as zero,
    sum(amount) as amount
FROM ds
GROUP BY key, value
The previous query results in the following error:
Column 'value' is present in the GROUP BY but not in the SELECT clause
To fix this, use the same alias in the GROUP BY:
SELECT
    key,
    multiIf(value = 0, 'isZero', 'isNotZero') as zero,
    sum(amount) as amount
FROM ds
GROUP BY key, zero
Don't use nested GROUP BYs
Don't use nested GROUP BY clauses in the Pipe that creates a Materialized View. While nested aggregations are possible, Materialized Views are processed in independent blocks, and this might yield unexpected results. Tinybird restricts these behaviors and throws an error when they're detected to avoid inaccurate results.
Consider the following query with nested GROUP BY clauses:
SELECT
    product,
    count() as c
FROM (
    SELECT
        key,
        product,
        count() as orders
    FROM ds
    GROUP BY key, product
)
GROUP BY product
The previous query throws the following error:
Columns 'key, product' are present in the GROUP BY but not in the SELECT clause
To fix this, make sure you don't nest GROUP BY clauses:
SELECT
    key,
    product,
    count() as orders
FROM ds
GROUP BY key, product
Avoid big scans
Avoid big scans in Materialized Views. When using JOINs, do them with a subquery to the Data Source you join to, not the whole Data Source.