Charts
Important: The Tinybird Charts library is not currently maintained. While existing implementations continue to work, no new features or bug fixes are being released. Additionally, the library is not compatible with React versions 19 or higher.
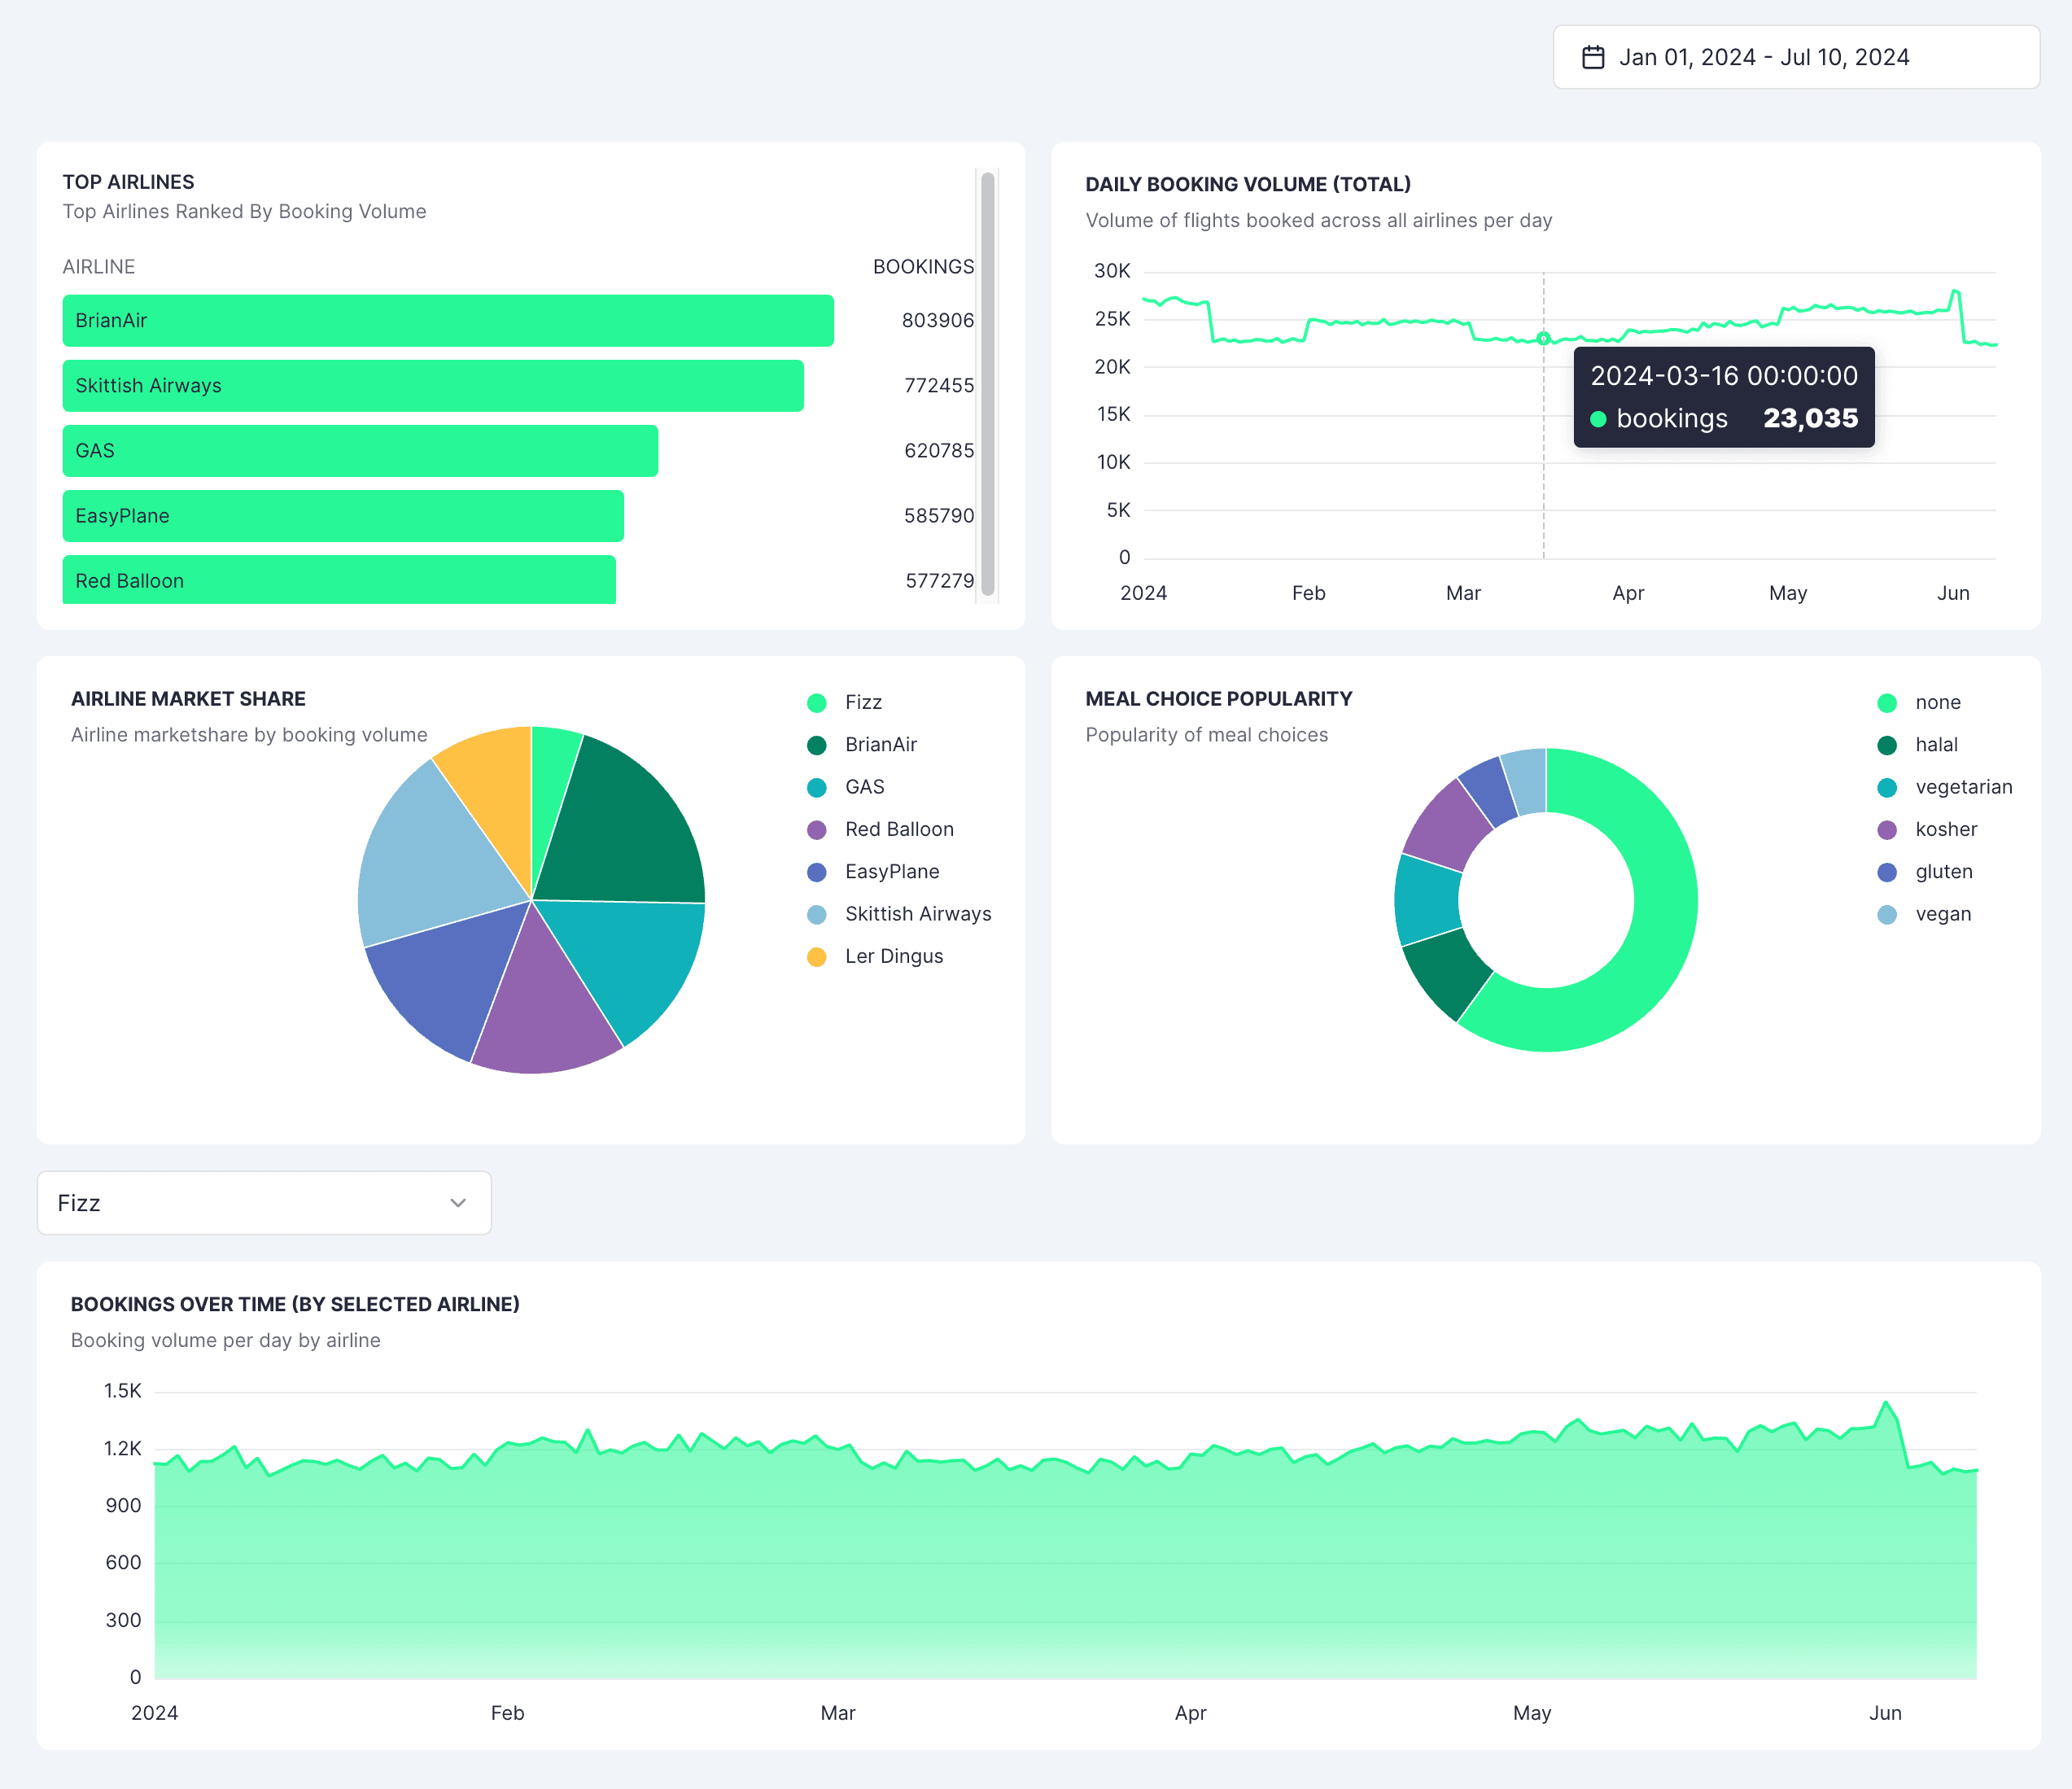
Charts are a great way to visualize your data. You can create and publish easy, fast Charts in Tinybird from any of your published API Endpoints.
Check out the live demo to see an example of Charts in action.
You can't create or manage charts using Tinybird CLI.
Overview
When you publish an API Endpoint, you often want to visualize the data in a more user-friendly way. Charts are a great way to do this.
Tinybird provides three options:
- No-code: A fast, UI-based flow for creating Charts that live in your Tinybird Workspace UI (great for internal reference use, smaller projects, and getting started).
- Low code: Using the Tinybird UI to create Charts and generate an iframe, which you can then embed in your own application.
- Code-strong: Using the
@tinybirdco/chartsnpm React library to build out exactly what you need, in your own application, using React components. Fully customizable and secured with JWTs. You can either generate initial Chart data in the Tinybird UI, or start using the library directly.
Instead of coding your own charts and dashboards from scratch, use Tinybird's pre-built Chart components. You won't have to implement the frontend and backend architecture, or any security middleware. Use the library components and JWTs, manage the token exchange flow, and interact directly with any of your published Tinybird API Endpoints.
To create a Chart, you need to have a published API Endpoint. Learn how to publish an API Endpoint here.
The Tinybird Charts library
All options are built on the Tinybird Charts library (@tinybirdco/charts), a modular way to build fast visualizations of your data, which leverages Apache ECharts. You can use Tinybird Charts with any level of customization, and also use your Tinybird data with any third party library.
Components
The library provides the following components:
AreaChartBarChartBarListDonutChartLineChartPieChartTable
All components share the same API, making it easy to switch between different types of charts.
The Tinybird Charts library is currently in public beta. If you have any feedback or suggestions, contact Tinybird at support@tinybird.co or in the Community Slack.
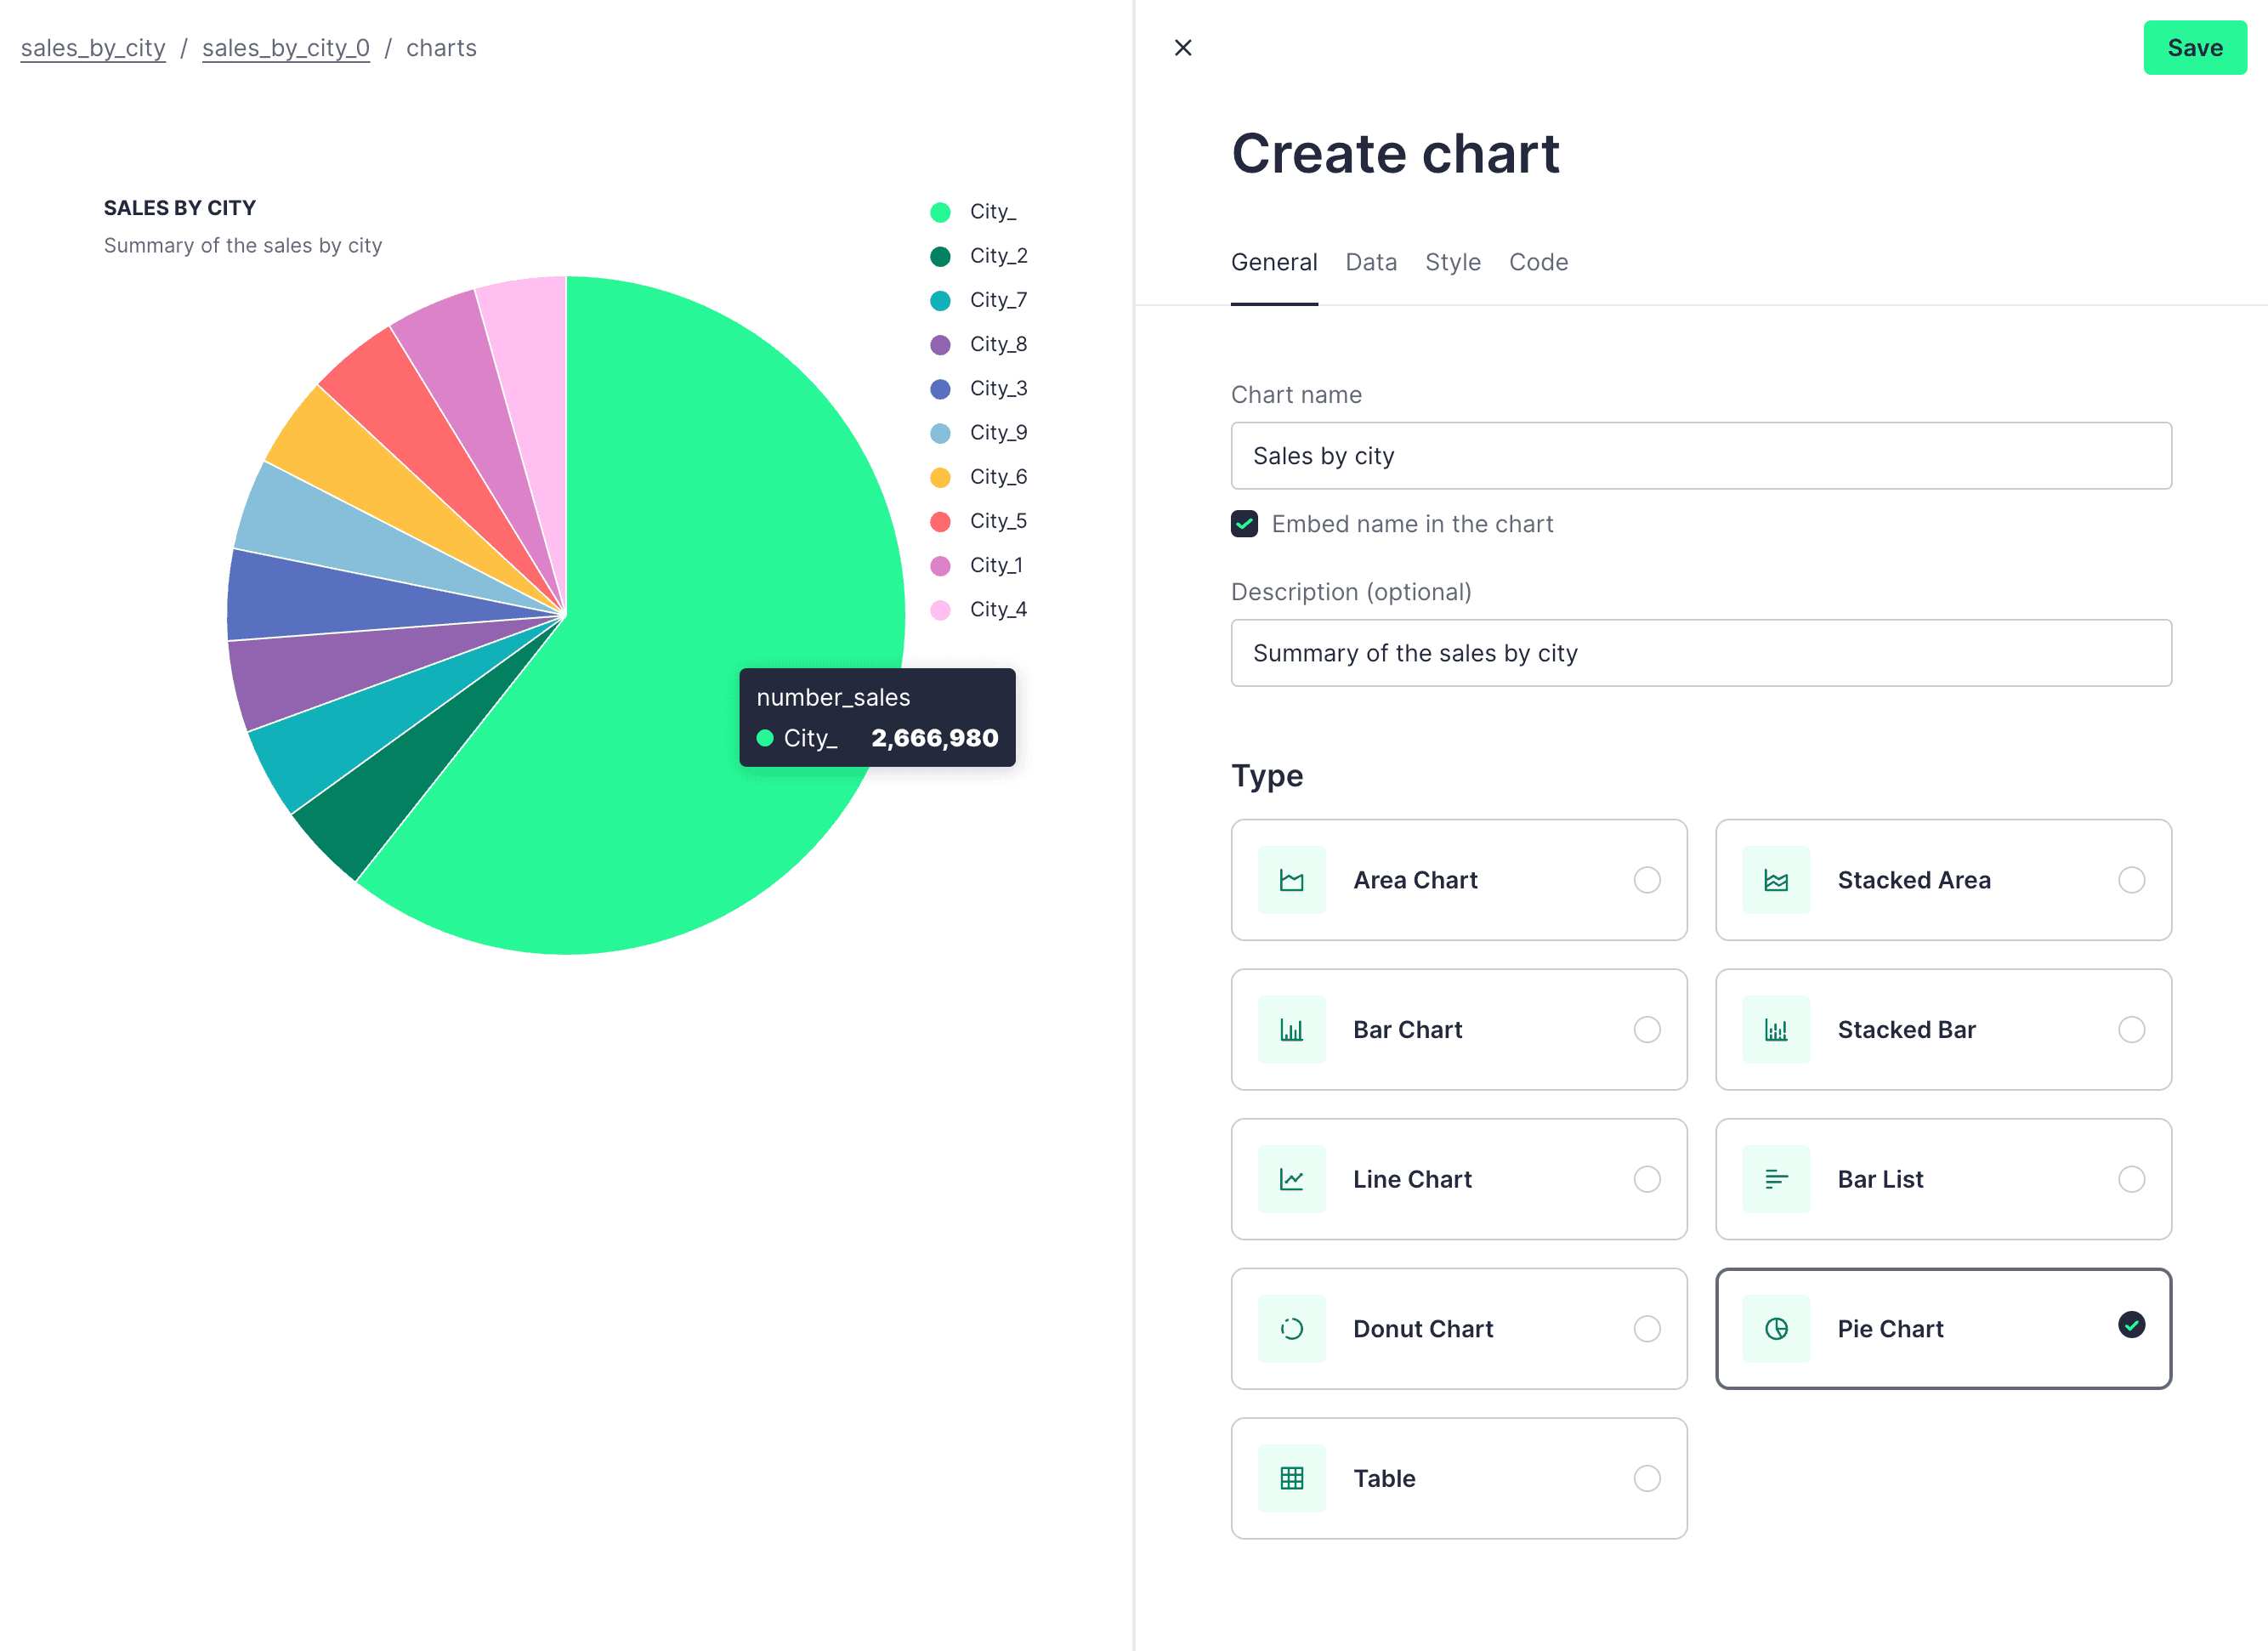
Create a Chart in the UI (no-code)
- In your Workspace, navigate to the Overview page of one of your API Endpoints.
- Select the "Create Chart" button (top right).
- Configure your Chart by selecting the name, the type of Chart, and the fields you want to visualize. Under "Data", select the index and category.
- Once you're happy with your Chart, select "Save".
Your Chart now lives in the API Endpoint Overview page.
Create a Chart using an iframe (low code)
Tinybird users frequently want to take the data from their Tinybird API Endpoints, create charts, and embed them in their own dashboard application. A low-overhead option is to take the generated iframe and drop it into your application:
- Create a Chart using the process described above.
- In the API Endpoint Overview page, scroll down to the "Charts" tab and select your Chart.
- Select the
<>tab to access the code snippets. - Copy and paste the ready-to-use iframe code into your application.
Create a Chart using the React library (code-strong)
This option gives you the most customization flexibility. You'll need to be familiar with frontend development and styling.
To create a Chart component and use the library, you can either create a Chart in the UI first, or use the library directly. Using the library directly means there will not be a Chart created in your Workspace, and no generated snippet, so skip to #2.
1. View your Chart code
- In your Workspace, navigate to the API Endpoint Overview page.
- Scroll down to the "Charts" tab and select one of your Charts.
- Select the
<>tab to access the code snippets. - You now have the code for a ready-to-use React component.
2. Install the library
Install the @tinybirdco/charts library locally in your project:
npm install @tinybirdco/charts
3. Create a JWT
Calls need to be secured with a token. To learn more about the token exchange, see Understanding the token exchange.
In React code snippets, the Chart components are authenticated using the token prop, where you paste your Tinybird Token.
You can limit how often you or your users can fetch Tinybird APIs on a per-endpoint or per-user basis. See Rate limits for JWTs.
Create a JWT
There is wide support for creating JWTs in many programming languages and frameworks. See the Tinybird JWT docs for popular options.
4. Embed the Chart into your application
Copy and paste the Chart snippet (either generated by Tinybird, or constructed by you using the same configuration) into your application. For example:
import React from 'react'
import { LineChart } from '@tinybirdco/charts'

function MyLineChart() {
  return (
    <LineChart
      categories={['category1', 'category2']}
      index="index_field"
      title="My Line Chart"
      description="This is a line chart"
      showLegend={true}
      height={400}
      width="100%"
      endpoint="https://<your_host>/v0/pipes/my_pipe.json"
      token="your_tinybird_token"
      params={{ filter: 'value' }}
      backgroundColor="#fff"
      textColor="#333"
      borderRadius="8px"
    />
  )
}
5. Fetch data
The most common approach for fetching and rendering data is to directly use a single Chart component (or group of individual components) by passing the required props. These are included by default within each generated code snippet, so for most use cases, you should be able to simply copy, paste, and have the Chart you want.
The library offers many additional props for further customization, including many that focus specifically on fetching data. See 6. Customization for more.
Alternative approaches and integrations
Depending on your needs, you have additional options:
- Wrapping components within
<ChartProvider>to share styles, query configuration, and custom loading and error states among several Chart components. - Adding your own fetcher to the
ChartProvider(or to a specific Chart component) using thefetcherprop. This can be useful to add custom headers or dealing with JWT tokens. - Using the
useQueryhook to fetch data and pass it directly to the component. It works with any custom component, or with any third-party library like Tremor or shadcn.
6. Customization
Tinybird supports customization:
- Standard customization: Use the properties provided by the
@tinybirdco/chartslibrary. - Advanced customization: Send a specific parameter to customize anything within a Chart, aligning with the ECharts specification.
7. Filtering
Filtering is possible by using the endpoint parameters. Use the params data-fetching property to pass your parameters to a chart component, <ChartProvider>, or the useQuery hook. See the example snippet for how params and filter are used.
8. Advanced configuration (optional)
Polling
Control the frequency that your chart polls for new data by setting the refreshInterval prop (interval in milliseconds). The npm library offers a range of additional component props specifically for data fetching, so be sure to review them and use a combination to build the perfect chart.
Use of this feature may significantly increase your billing costs. The lower the refreshInterval prop (so the more frequently you're polling for fresh data), the more requests you're making to your Tinybird API Endpoints. Read the billing docs and understand the pricing of different operations.
Global vs local settings
Each chart can have its own settings, or settings can be shared across a group of Chart components by wrapping them within <ChartProvider>.
States
Chart components can be one of a range of states:
- Success
- Error
- Loading
Example use cases
Two examples showing different ways to generate JWTs, set up a local project, and implement a Chart:
Interested in Charts but don't have any data to use? Run the demo in the Add Tinybird Charts to a Next.js frontend guide, which uses a bootstrapped Next.js app and fake data.
Troubleshooting
Handle token errors
See the information on JWT error handling.
Refresh token
See the information on JWT refreshing and limitations.
Next steps
- Check out the Tinybird Charts library on npm (
@tinybirdco/charts). - Understand how Tinybird uses Tokens.