Query your ingested data
After you've brought your data to Tinybird, you can explore and manipulate it to make it more useful and relevant.
Data Flow
Data Flow visualizes how your Data Sources, API Endpoints, Materialized Views, and Pipes connect and relate to each other.
You can filter the view by keyword, resource type, or tag. Select an item to see its details in the side panel.
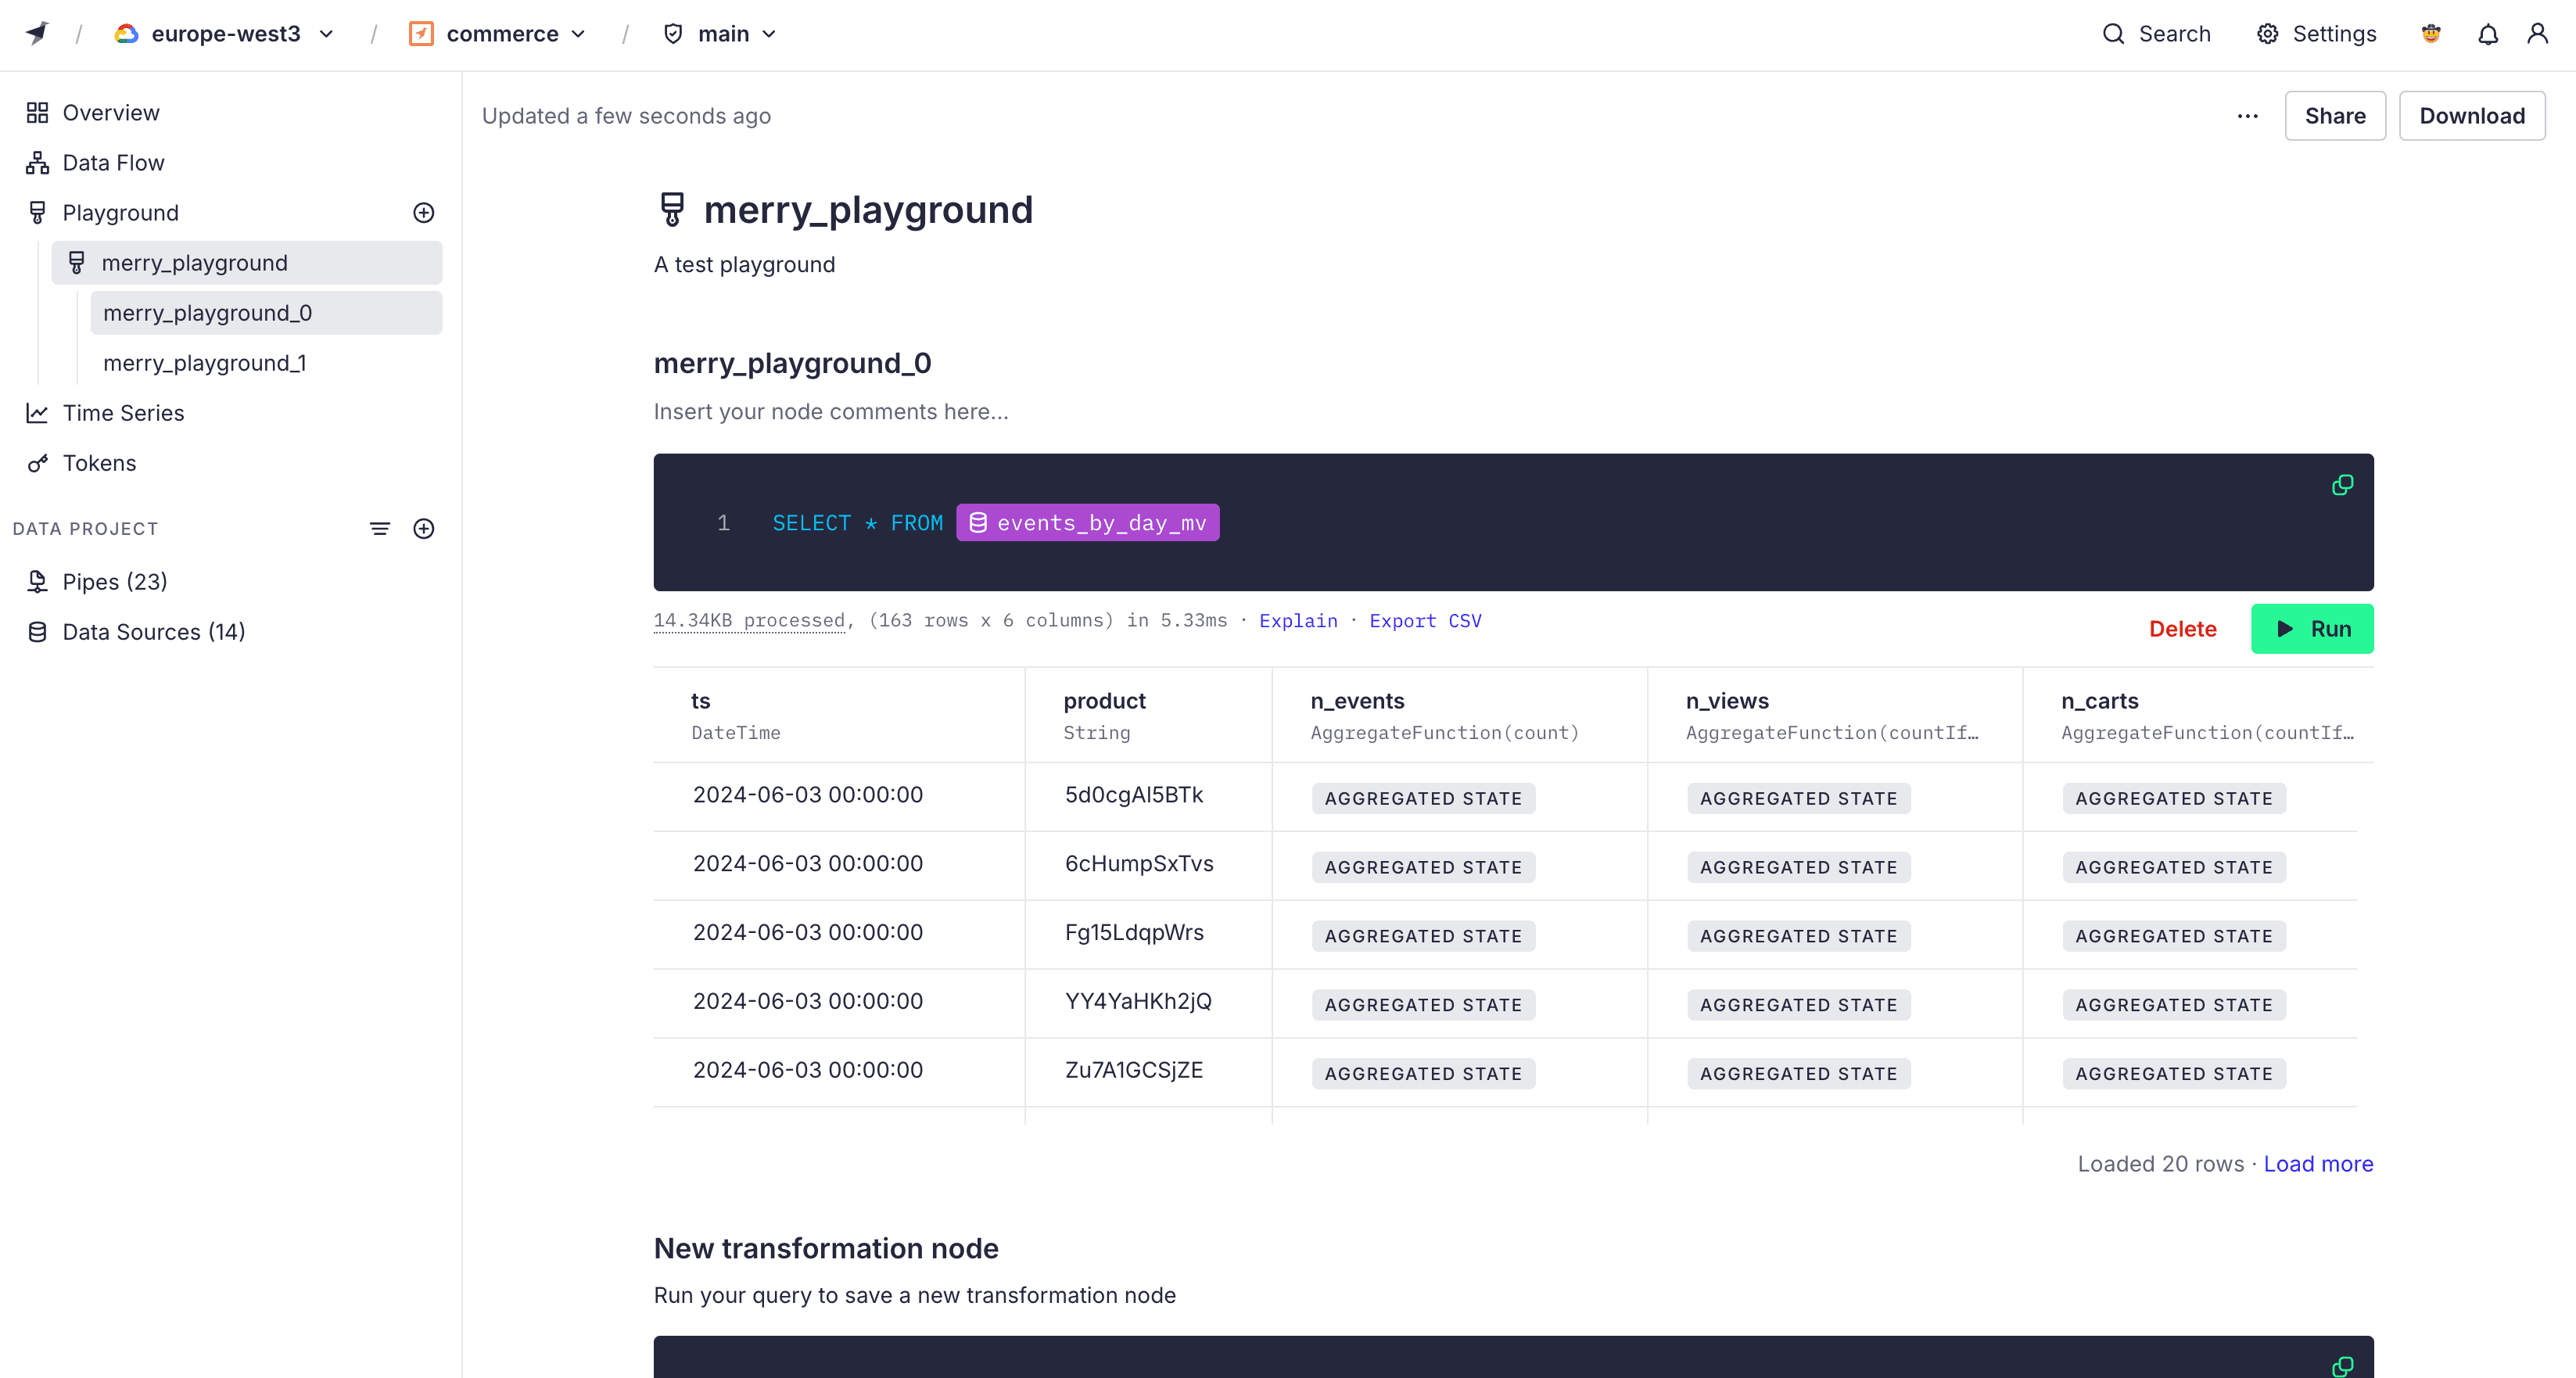
Playground
Playgrounds are sandbox environments where you can test your queries using ingested data. For example, you can use playgrounds to quickly query real-time production data, debug existing queries, or prototype new Pipes.
You can download any playground by selecting Download. You can then add the .pipe file to your project. To share your Playground contents with other users of the Workspace, select Share.
For more information on the statements, functions, and settings you can use in queries, see SQL reference.
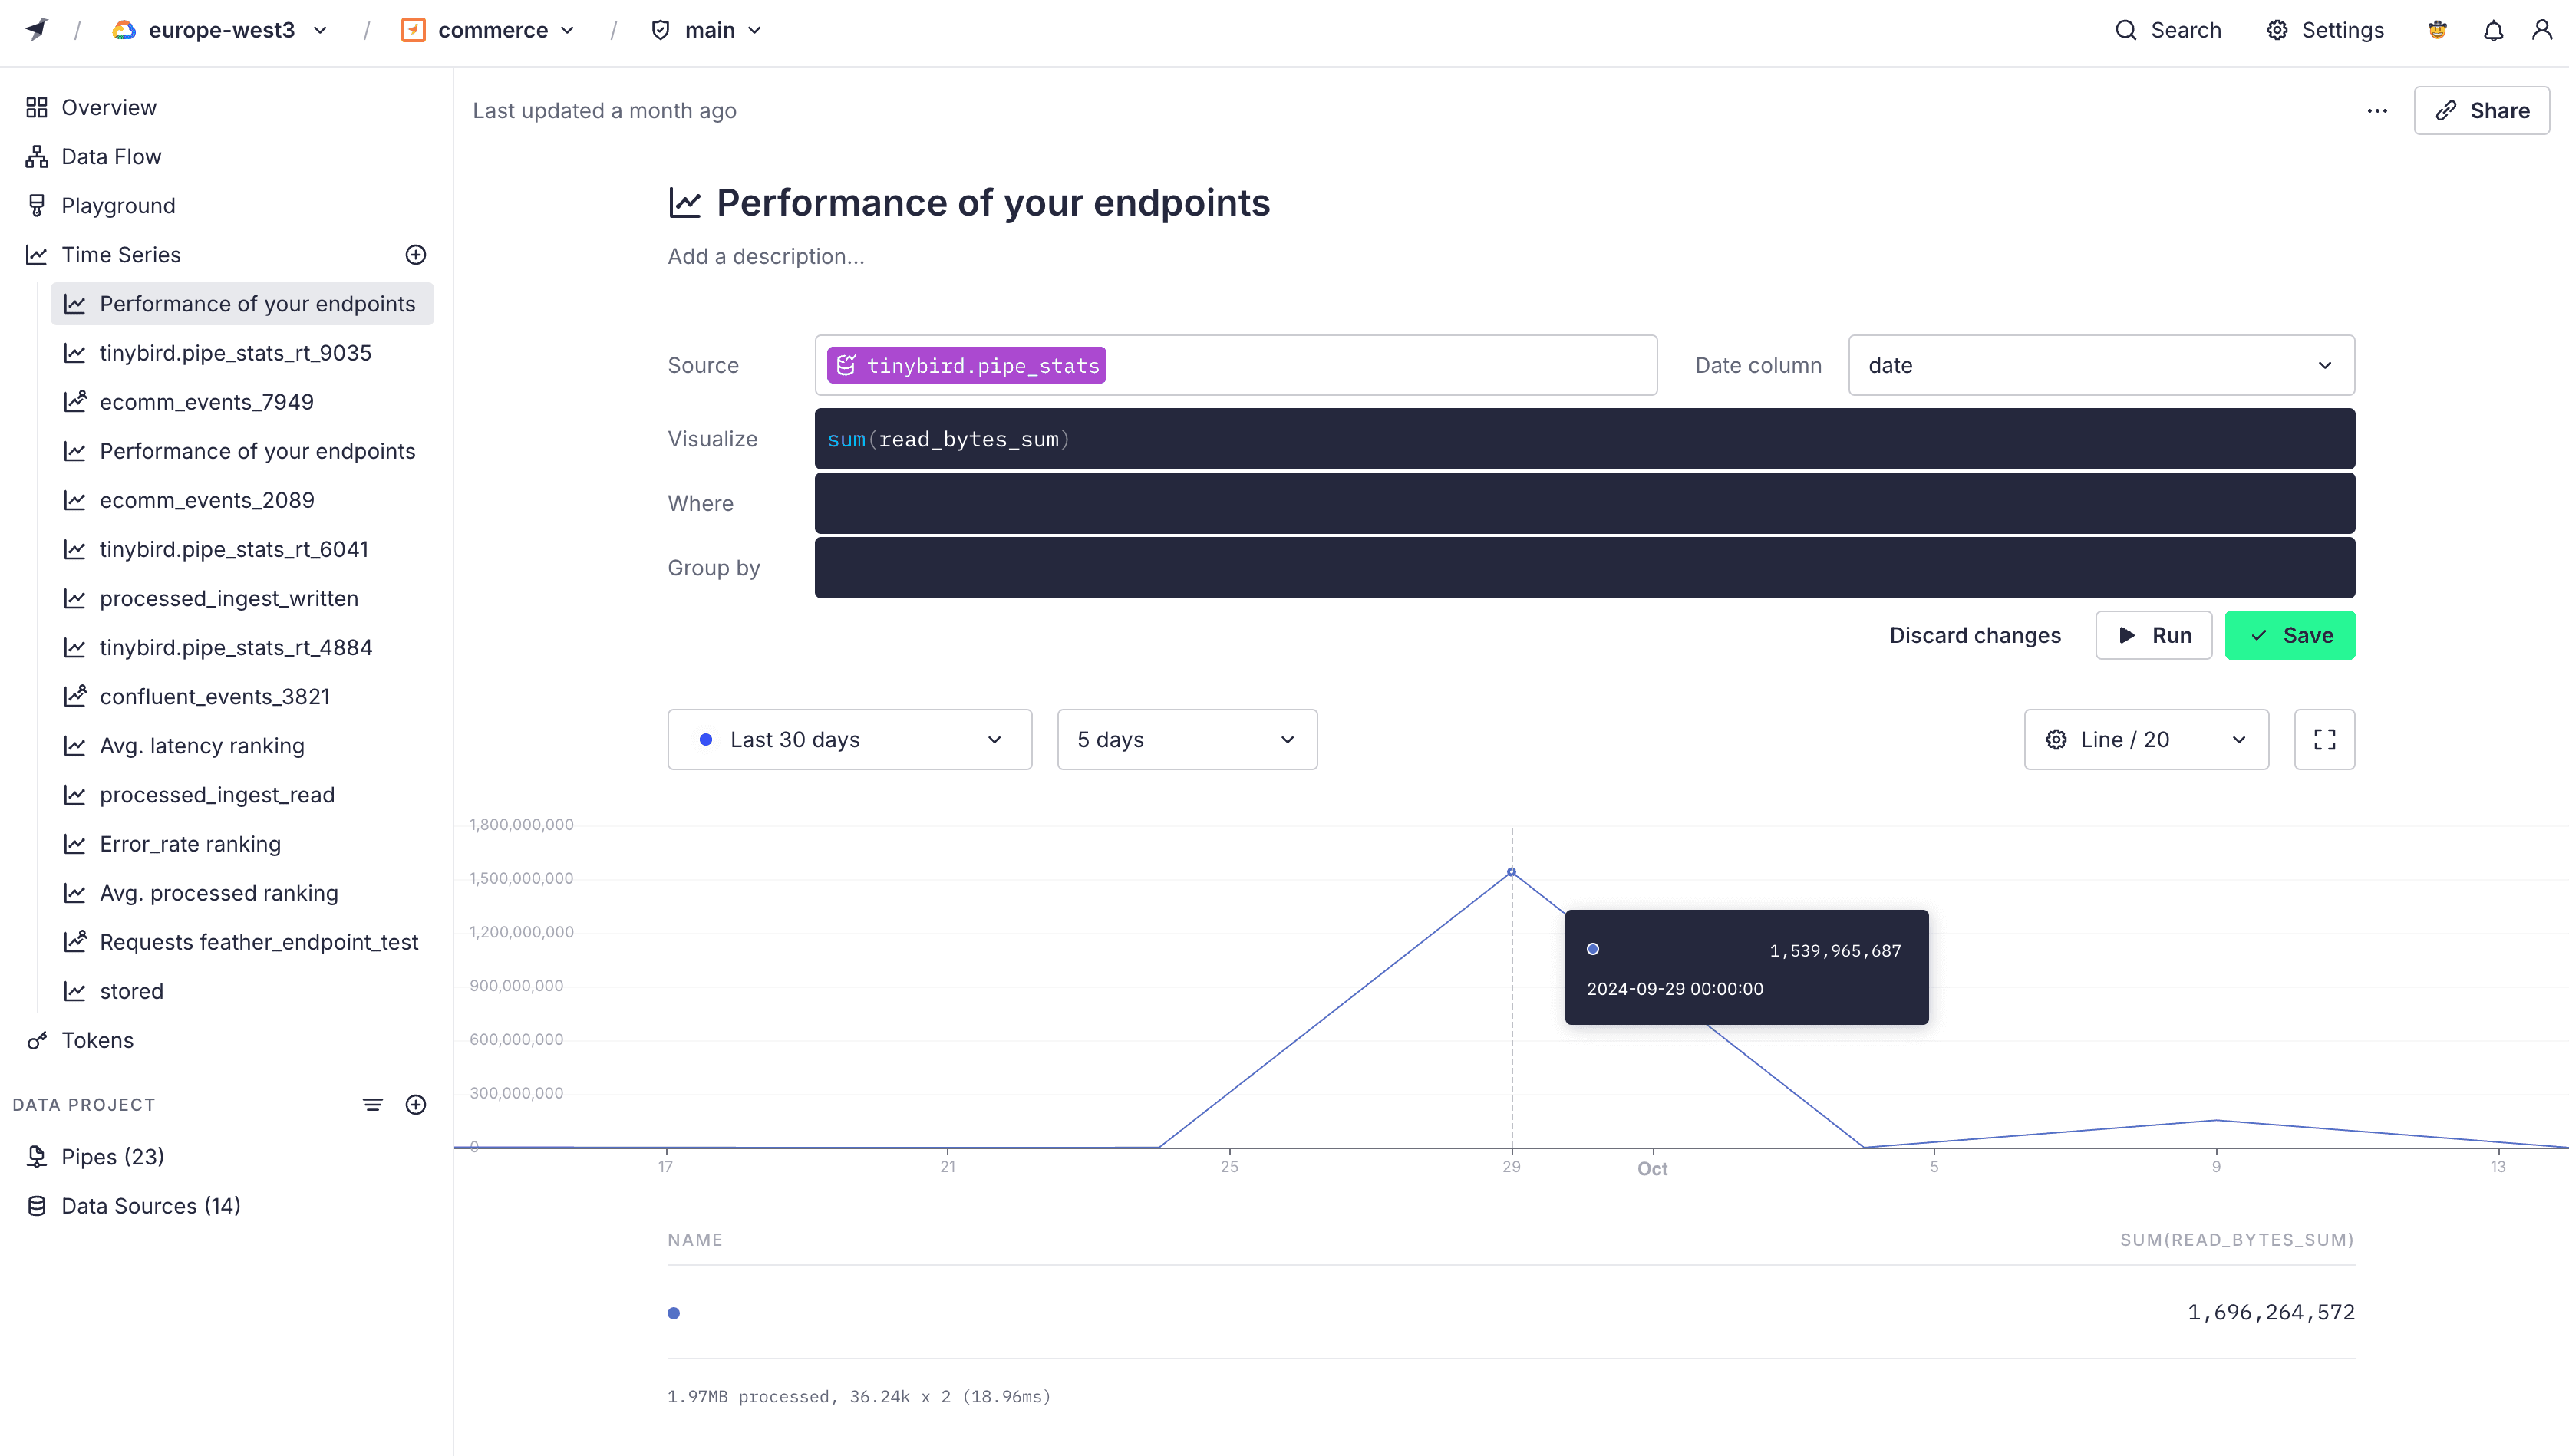
Time Series
Time series help analyze a sequence of data points collected over an interval of time. Use the Time Series feature to visualize any time series Data Source in your Workspace, including Service Data Sources.
When you create a new Time Series in your Workspace, your team can view it. You can also generate a public URL to share the visualization outside of your team. Viewers using the public URL can explore the chart but can't change the original data source, filters, or groupings.
Next steps
- Learn how to use query parameters.
- Read the SQL best practices.