---
title: "Build a real-time dashboard in Python with Tinybird and Dash"
excerpt: "Want to build a real-time dashboard with Python? Here's a step-by-step guide with included code that shows you how."
authors: "Cameron Archer"
categories: "I Built This!"
createdOn: "2023-11-03 00:00:00"
publishedOn: "2023-11-06 00:00:00"
updatedOn: "2026-05-18 00:00:00"
status: "published"
---

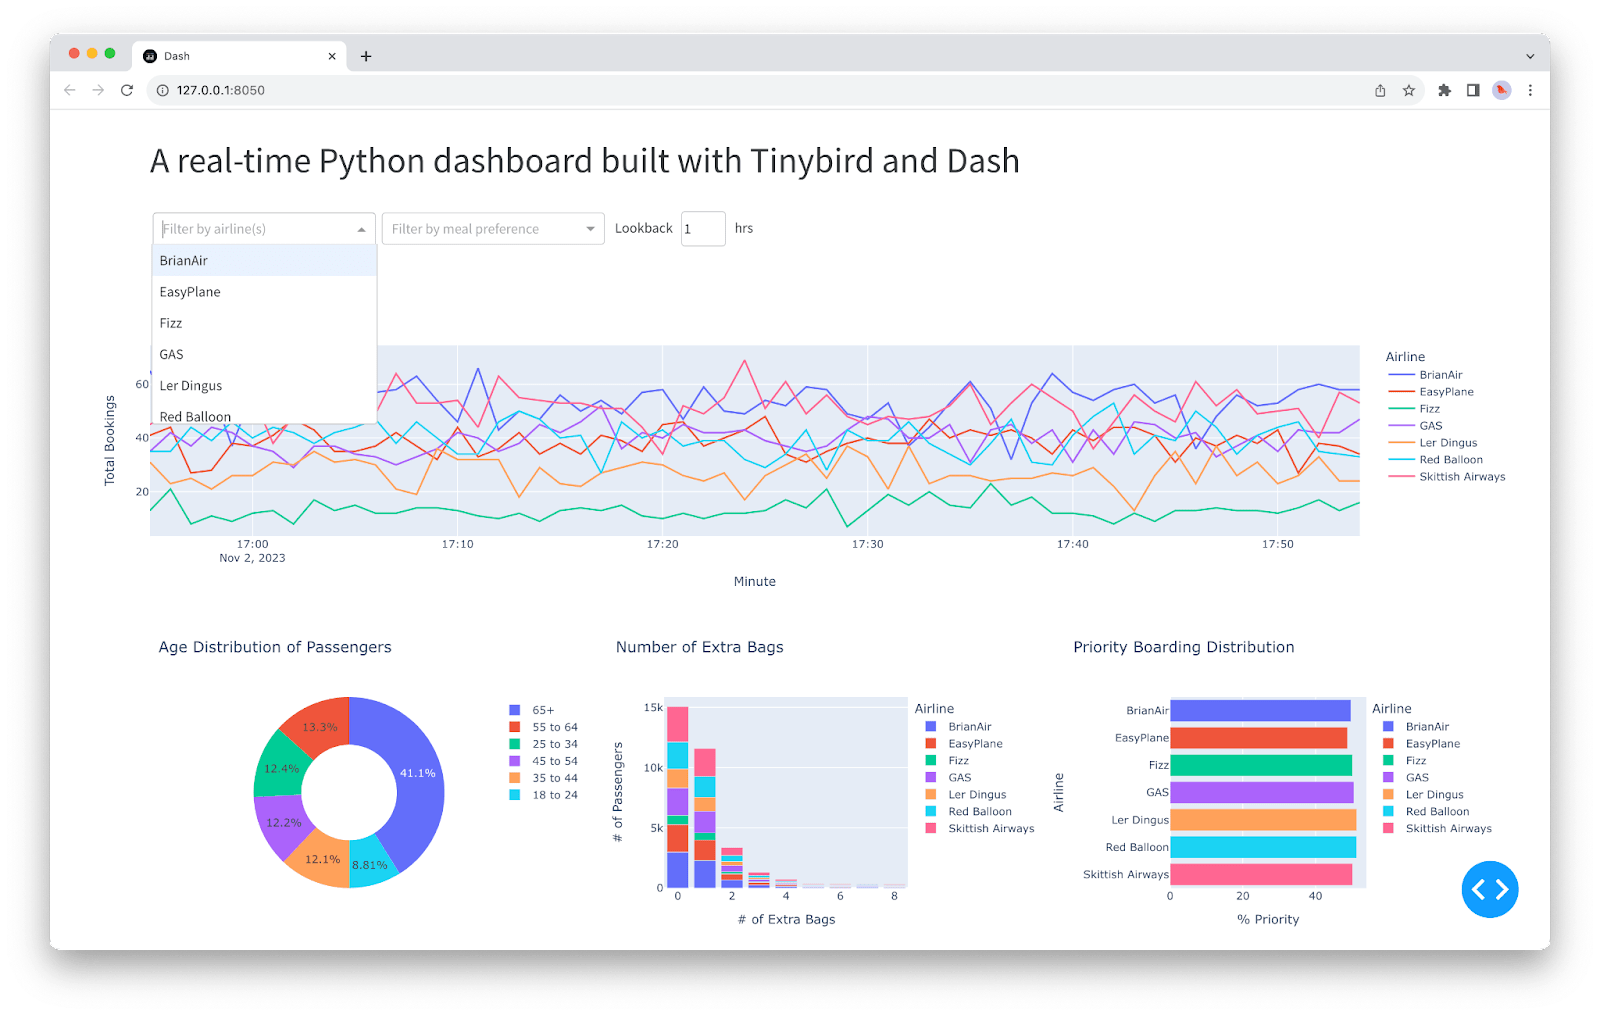
<p>Python is a powerful coding language for data analysis, thanks to libraries like <code>numpy</code>, <code>pandas</code>, and now <code>polars</code>. </p><p>There are also some great Python libraries for data visualization, for example, <code>matplotlib</code>, <code>plotly</code>, <code>highcharts</code>, and <code>seaborn</code>. For those building data applications, understanding the landscape of available python dashboard library options is crucial. As such, Python has been widely adopted in data science, machine learning, and data engineering as a go-to language for data analysis and data visualization.</p><p>While Python is good for data analysis and basic data visualizations thanks to its many libraries, you still might want to be able to build <a href="https://www.tinybird.co/blog-posts/real-time-dashboards-are-they-worth-it" rel="noreferrer">real-time dashboards</a> in Python that refresh as new data is created while also handling a greater level of scale than a single machine can support. Building a python dashboard that scales requires both powerful visualization tools and a backend analytics engine.</p><p>In this tutorial, I'll show you how to build a dashboard python application using <a href="https://www.tinybird.co" rel="noreferrer">Tinybird</a>, a serverless real-time data analytics platform, and <a href="https://dash.plotly.com" rel="noreferrer">Dash</a>, an open source app-building framework for Python. </p><p>Here's what the final product looks like:</p><figure class="kg-card kg-image-card kg-card-hascaption"><img src="https://tinybird-blog.ghost.io/content/images/2023/11/python-real-time-dashboard-min.png" class="kg-image" alt="A real-time dashboard written in Python using Tinybird and Dash." loading="lazy" width="1600" height="1015" srcset="https://tinybird-blog.ghost.io/content/images/size/w600/2023/11/python-real-time-dashboard-min.png 600w, https://tinybird-blog.ghost.io/content/images/size/w1000/2023/11/python-real-time-dashboard-min.png 1000w, https://tinybird-blog.ghost.io/content/images/2023/11/python-real-time-dashboard-min.png 1600w" sizes="(min-width: 720px) 720px"><figcaption><span style="white-space: pre-wrap;">A real-time dashboard written in Python using Tinybird and Dash</span></figcaption></figure><p>We'll use Tinybird to capture streaming data, transform it with SQL, and publish transformations as REST APIs. Utilizing the community-developed <a href="https://github.com/localstack/verdin" rel="noreferrer">Verdin Tinybird SDK</a> for Python, we'll consume data from Tinybird APIs in Python and visualize them in real time with Dash, adding interactive filtering to our real-time dashboard using Dash input components and Tinybird query parameters.</p>
<!--kg-card-begin: html-->
<div class="tip-box"><div class="tip-box-container"><div class="tip-box-title">Free Training: Build Real-Time Dashboards</div><div class="tip-box-content">Learn how to build a real-time dashboard from end-to-end in our online free training. <a href="https://www.tinybird.co/docs/live/kafka-real-time-dashboard?utm_campaign=q1-2024-blog-lcs-referral">Watch the recording</a>.</div></div></div>
<!--kg-card-end: html-->
<h2 id="step-by-step-build-a-real-time-python-dashboard">Step-by-step: Build a real-time Python dashboard</h2><p>Follow this step-by-step tutorial to build a real-time dashboard in Python with Tinybird and Dash. If you get stuck along the way, all of the final code is in <a href="https://github.com/tinybirdco/real-time-python-dashboard" rel="noreferrer">this GitHub repository</a>, which you can use for reference. You can also chat with Tinybird engineers in our <a href="https://www.tinybird.co/docs/community" rel="noreferrer">Slack community</a> if you need help.</p><h3 id="prerequisities">Prerequisities</h3><p>First, let's get the prereqs out of the way. We're going to install <code>dash</code> and its dependencies, <code>verdin</code>, and the Tinybird CLI.</p>
<!--kg-card-begin: html-->
<iframe width="100%" src="https://snippets.tinybird.co/XQAAAAKCAQAAAAAAAABBKUqGk9nLKvRDYX9xqZVG2XYiEW2npjxFCS2CxRt_CCNlxbJiiid2pfbUb_JEWuHW9qASRL1ycYFDyrx7ddTWIFfOnpcaQqcIUY_d6pNg-nhNbGytzZ9YyK3xvu3cnmunRdRb-KzPrX2YM0_RcROdOLc5uTDygqYNYXETNGuMvFGUJoZAenvLvJAypBHaXZAV9AC2sR6jFh8qjqWfEcqoaLtk8HQj2tidNbrlmuK5kWGrTcUD1Ar2rufxWtbpjyI4X6mVOYMiisRjqb75hYOvvsOm4ksLEzYSk648q6TtuuXE6ujYNSIys5ho93l-XMx276CvLMckkO-6SD7rt7oC06NqfJ07esH_jmpAAA/embed"></iframe>
<!--kg-card-end: html-->

<!--kg-card-begin: html-->
<div class="tip-box"><div class="tip-box-container"><div class="tip-box-title">Note</div><div class="tip-box-content">I'm assuming you have Python >3.8 installed.</div></div></div>
<!--kg-card-end: html-->
<p>Go to <a href="https://www.tinybird.co/signup">tinybird.co/signup</a> and get a free Tinybird account. You'll be taken to the Tinybird UI, where you can create your first Workspace. You can call the Workspace whatever you'd like, but I'll be calling it <code>python_dashboard</code> to align with my project directory.</p>
<!--kg-card-begin: html-->
<div class="tip-box"><div class="tip-box-container"><div class="tip-box-title">Note</div><div class="tip-box-content">Free Tinybird Workspaces can be created in an EU GCP cluster or a US-East GCP cluster. Choose the one nearest you for the fastest API responses</div></div></div>
<!--kg-card-end: html-->
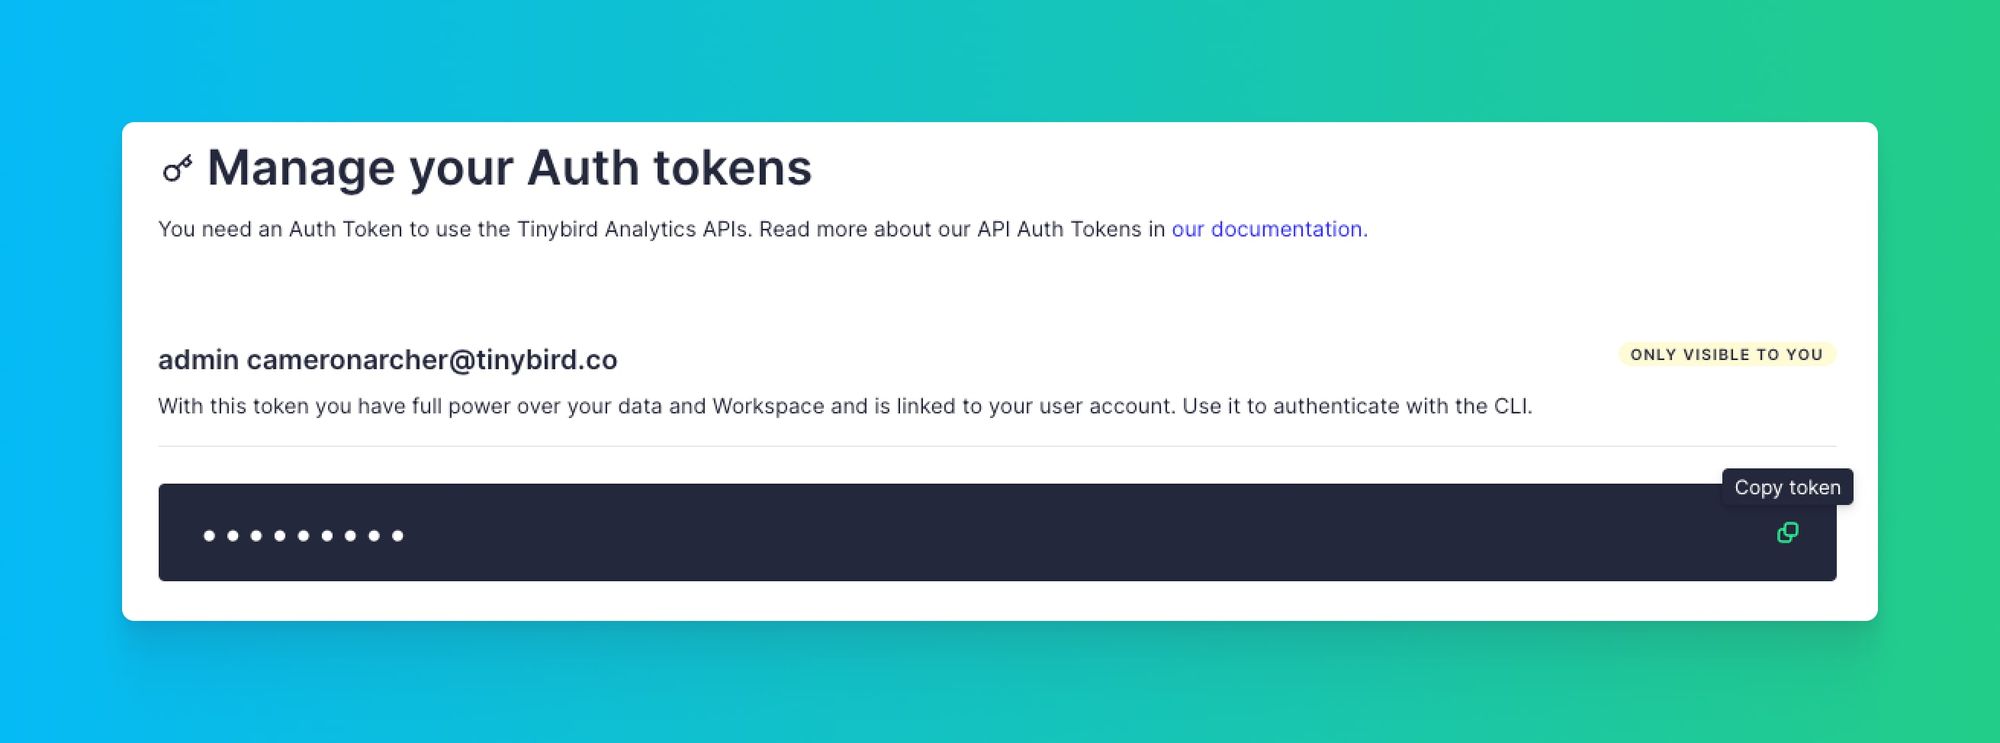
<p>Once you've created your Workspace, copy your <strong>user admin token</strong> (the one with your email address) from the "Tokens" section of your Workspace.</p><figure class="kg-card kg-image-card kg-card-hascaption"><img src="https://tinybird-blog.ghost.io/content/images/2023/11/token-min.jpg" class="kg-image" alt="A screenshot of the Tinybird UI user admin token" loading="lazy" width="2000" height="743" srcset="https://tinybird-blog.ghost.io/content/images/size/w600/2023/11/token-min.jpg 600w, https://tinybird-blog.ghost.io/content/images/size/w1000/2023/11/token-min.jpg 1000w, https://tinybird-blog.ghost.io/content/images/size/w1600/2023/11/token-min.jpg 1600w, https://tinybird-blog.ghost.io/content/images/2023/11/token-min.jpg 2000w" sizes="(min-width: 720px) 720px"><figcaption><span style="white-space: pre-wrap;">Copy your </span><b><strong style="white-space: pre-wrap;">user admin token</strong></b><span style="white-space: pre-wrap;"> from the Tinybird UI.</span></figcaption></figure><p>Then, create a subdirectory in your project called <code>data-project</code> and authenticate to your Tinybird Workspace:</p>
<!--kg-card-begin: html-->
<iframe width="100%" src="https://snippets.tinybird.co/XQAAAAKqAAAAAAAAAABBKUqGk9nLKzhPKuPh7oRElEdKJJt3Hc_ru0h7CzUY13P1bosFylBNBeYnoQFH7cOKujdWKXSs-J3fM3oHiECFrb-yOdYpndqoXgKSwPSjv5BCbOpweiV1IRpGp5n7P8iBpi6qw5hakH1qnu6UNvQYsSi-2kVzkqM7rQg5A906sLdqi7Hz6LnMymlJ3_-8j0AA/embed"></iframe>
<!--kg-card-end: html-->

<!--kg-card-begin: html-->
<div class="tip-box"><div class="tip-box-container"><div class="tip-box-title">Note</div><div class="tip-box-content">Your token gets stored in a <code>.tinyb</code> file (which you already added to your <code>.gitignore</code>).
</div></div></div>
<!--kg-card-end: html-->
<h2 id="step-2-ingest-data-into-tinybird">Step 2: Ingest data into Tinybird</h2><p>In a typical Dash app, you'd load the entire data set into memory as a <code>pandas</code> DataFrame, perhaps from a CSV file. Then, you'd build metrics for your graphs by querying the DataFrame using the <code>pandas</code> library to get the results you want to display. This can start to become computationally expensive, however, when the data set gets larger.</p><p>So, for our real-time dashboard, we're going to offload all of the <a href="https://www.tinybird.co/blog-posts/real-time-data-processing" rel="noreferrer">real-time data processing</a> to Tinybird, freeing up memory for our Dash app so it can be as fast as possible.</p><p>To start, we need to begin ingesting a data stream into Tinybird.</p><p>In this tutorial, I'm using the <a href="https://github.com/tinybirdco/mockingbird">open source Mockingbird CLI</a> to generate some mock data streams and send them to Tinybird using its <a href="https://www.tinybird.co/docs/ingest/events-api.html">HTTP streaming API</a>.</p><p>If you want to follow along, you can install the Mockingbird CLI with:</p>
<!--kg-card-begin: html-->
<iframe width="100%" src="https://snippets.tinybird.co/XQAAAALsAAAAAAAAAABBKUqGk9nLKwjbltX1SgJDPaQELsgO9PCrPFiVDb45ZePKRZ6GlcBM4X0a-sI9-znaeRX0mCX5U_hkJjvO6D8QfQyz0ebxUq0SKmm-oiYqPsfHeLidgsfi-jtmzJgVFeYBj3C2ER0LOLjf4mo6DGQZhUJrZ7-zeX2EOYFQcWG6BZk83VGVODlQS4WhSWiGU71JDMi69JLqmw3ylbCX9JFrM86CQu6qFcKzrykHhN2wN1jKpc5BmwsqVBAYlaCmmN0xdnBlwhsgAcP_pj40IA/embed"></iframe>
<!--kg-card-end: html-->

<!--kg-card-begin: html-->
<div class="tip-box"><div class="tip-box-container"><div class="tip-box-title">Note</div><div class="tip-box-content">Mockingbird is also available as a UI. If you'd prefer to use the UI, just go to <a href="https://mockingbird.tinybird.co">mockingbird.tinybird.co</a> and follow the steps to send data to Tinybird.</div></div></div>
<!--kg-card-end: html-->
<p>Of course, there are tons of ways to get data into Tinybird. Check out the "Ingest" portion of the <a href="https://www.tinybird.co/docs">Tinybird documentation</a> for more information on <a href="https://www.tinybird.co/blog-posts/real-time-data-ingestion" rel="noreferrer">real-time data ingestion</a>. Tinybird supports ingestion from streaming data sources like <a href="https://www.tinybird.co/docs/ingest/kafka.html" rel="noreferrer">Kafka</a> and <a href="https://www.tinybird.co/docs/ingest/confluent.html" rel="noreferrer">Confluent</a>, data warehouses like <a href="https://www.tinybird.co/docs/ingest/snowflake.html" rel="noreferrer">Snowflake</a> and <a href="https://www.tinybird.co/docs/ingest/bigquery.html" rel="noreferrer">Google BigQuery</a>, object storage like <a href="https://www.tinybird.co/docs/ingest/s3.html" rel="noreferrer">Amazon S3</a>, and even good ol' fashioned <a href="https://www.tinybird.co/docs/ingest/datasource-api.html" rel="noreferrer">CSV files</a>.</p><p>In this example, I'll be using the <a href="https://mockingbird.tinybird.co/docs/schemas#flight-bookings" rel="noreferrer">Flight Bookings</a> template from Mockingbird, which has the following simplified schema:</p>
<!--kg-card-begin: html-->
<iframe width="100%" src="https://snippets.tinybird.co/XQAAAAKDAQAAAAAAAABBKUqGk9nLKzhOYFlsQdyxxXGsm1bG7OkQDA1h6wUwRLQ4Q-C74zv4FKpc6gThU-bg_GbA03mYpJ6rOfZt8q9hy8aMwKBo4w-8jMRn1_Zda-WOiP234uT71rJg1mcnAqqN-N8atxteAHvbU0uEwbF2Qyx_whGbN3tnqj1whBeYneN_vjO9tAVL9LyoRQdwZoPvsI60P8E_VtQ47z-ZKxc0DyEl5PfXglH3HbENOJ-MxN43e0ycA-93qOT4sOKyN1QLA6K6NGcO5Pqgw4vtDTQSL7EhR0bGcV8dT3Hg_2ndJ8dKhPsCkH0RQ4b_8_PeXA/embed"></iframe>
<!--kg-card-end: html-->
<p>To start sending data to Tinybird, run the following in your terminal:</p>
<!--kg-card-begin: html-->
<iframe width="100%" src="https://snippets.tinybird.co/XQAAAAIrAQAAAAAAAABBKUqGk9nLKwKopwyXgrjhmj1qtAj_cxHNB5bZI-5gFV8ncxEi0UBaQSrf2krpPnMP1UKimFByBQuMgsw_i64skzMoeu9p_DCTB1jI2hGFsT7jAtvJYeMQqjDqh0vRmMrx562Sk-YxPxoNq9IPLauyP0xWN50vtyaXYIfBUml3zeGT_rNIS3TU3OlO3l2iav8bJmPnWXk9WBlnrPn0qcPWOFHqPAtIq2FV2xtl2qKEFMGT5zDc5CMUlR7XwqeoxRD1K1NoUOL8FwHykHPcVX3hyqomKdYgApyZR9ljn_hpM_r6ZAB__5XuWgA/embed"></iframe>
<!--kg-card-end: html-->
<p>You should see a successful response sending 10 rows of mock data to Tinybird every second. You can continue to let this run in the background as you develop your dashboard.</p>
<!--kg-card-begin: html-->
<div class="tip-box"><div class="tip-box-container"><div class="tip-box-title">Note</div><div class="tip-box-content">You can stream up to 1,000 rows per second to Tinybird using Mockingbird.</div></div></div>
<!--kg-card-end: html-->
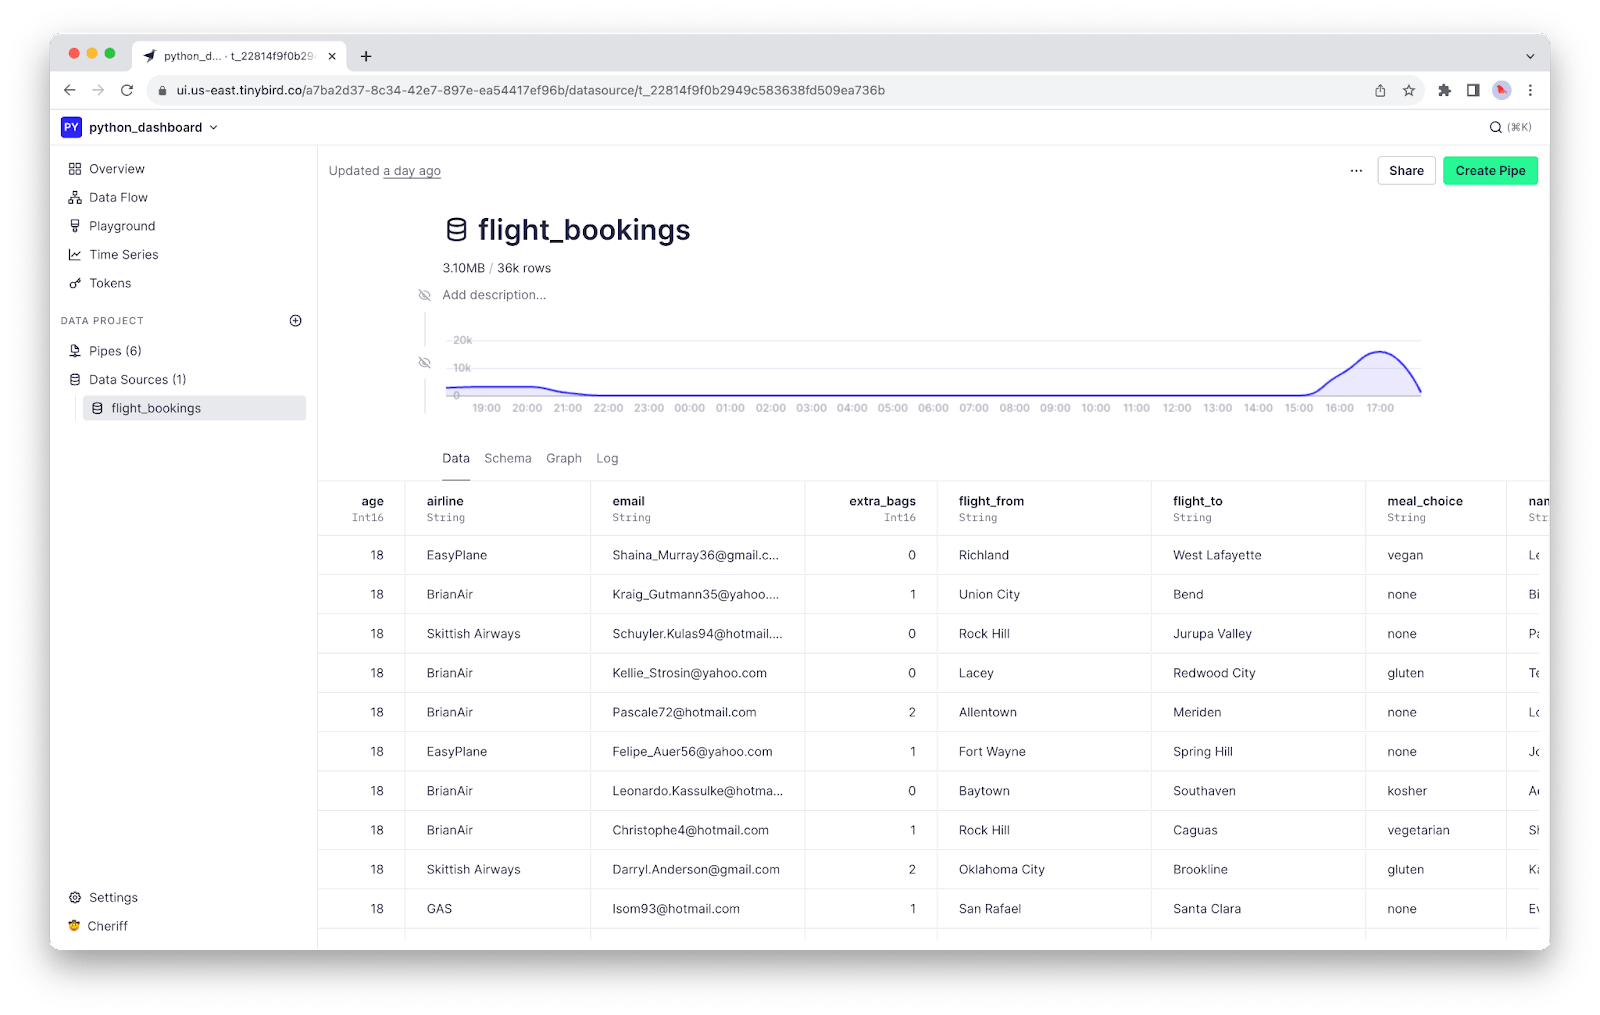
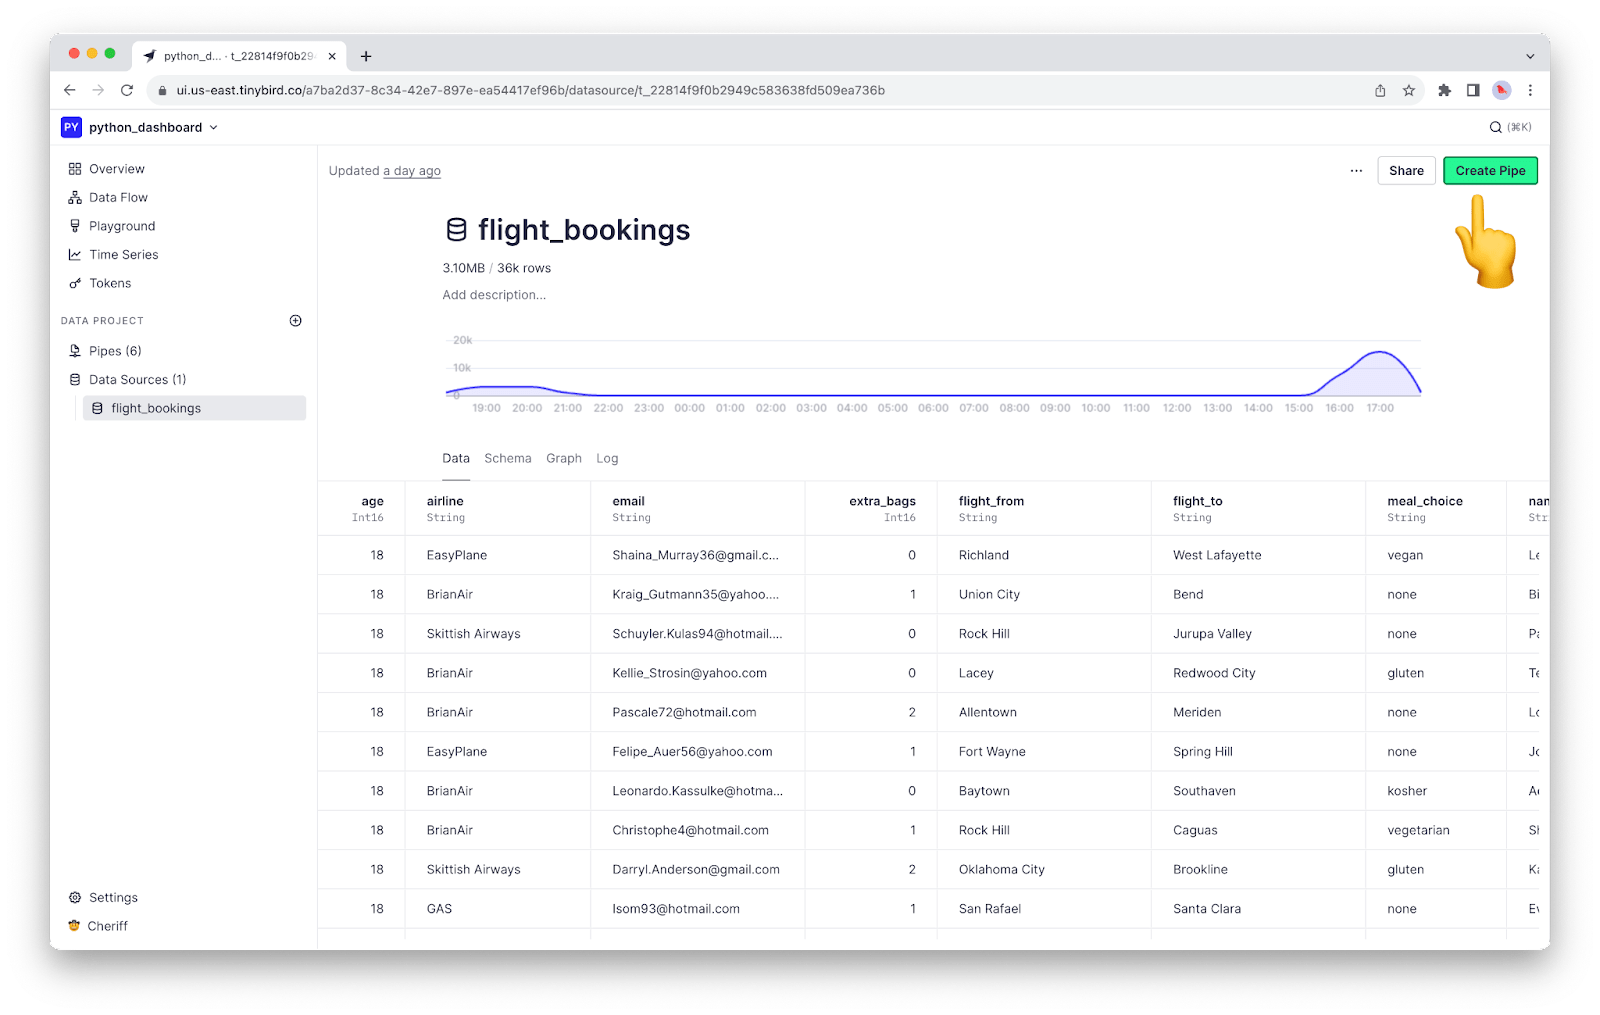
<p>If you navigate to the Tinybird UI, you will see the <code>flight_bookings</code> Data Source has been automatically created with data streaming in.</p><figure class="kg-card kg-image-card kg-card-hascaption"><img src="https://tinybird-blog.ghost.io/content/images/2023/11/flight_bookings-min.png" class="kg-image" alt="A screenshot of the Tinybird UI showing a Data Source called flight_bookings, with data streaming in." loading="lazy" width="1600" height="1015" srcset="https://tinybird-blog.ghost.io/content/images/size/w600/2023/11/flight_bookings-min.png 600w, https://tinybird-blog.ghost.io/content/images/size/w1000/2023/11/flight_bookings-min.png 1000w, https://tinybird-blog.ghost.io/content/images/2023/11/flight_bookings-min.png 1600w" sizes="(min-width: 720px) 720px"><figcaption><span style="white-space: pre-wrap;">The </span><code spellcheck="false" style="white-space: pre-wrap;"><span>flight_bookings</span></code><span style="white-space: pre-wrap;"> Data Source captures event streams and writes them into a column-oriented database on which we can build SQL queries to get our desired metrics.</span></figcaption></figure><p>You now have data in Tinybird! On to Step 3.</p><h2 id="step-3-create-dashboard-metrics-with-sql">Step 3: Create dashboard metrics with SQL</h2><p>In Tinybird, you use <a href="https://www.tinybird.co/docs/concepts/pipes.html">Pipes</a> to transform your data in real time using SQL. With Pipes, you can split up complex SQL queries into chained, composable Nodes. Then, you can add dynamic query parameters using templating and publish your metrics as scalable, secured REST APIs.</p><blockquote>In Tinybird, you create real-time data APIs with nothing but SQL.</blockquote><p>We'll use these APIs to get the data we want to visualize.</p><p>Again, the benefit here is that we don't have to load our data set onto our machine as a DataFrame, and we don't even have to query it locally. Instead, we'll simply get the results from the Tinybird APIs as JSON, and load those (much smaller) results into pandas DataFrames, solely to visualize them with Dash.</p><p>In the <a href="https://github.com/tinybirdco/real-time-python-dashboard/tree/main/data-project/pipes" rel="noreferrer">GitHub repo for this project</a>, you'll find six (6) <code>.pipe</code> files that represent the SQL transformations we'll do to get the metrics we want to visualize. Two of these Pipes (<code>airlines.pipe</code> and <code>meals.pipe</code>) define helper APIs that we'll use to dynamically populate options for our dropdown filters, and the remaining four provide data for our visualizations.</p><h3 id="create-your-first-api">Create your first API</h3><p>Let's start by creating the Pipe that gets the full list of airlines in our data set. From the <code>flight_bookings</code> Data Source page, click "Create Pipe".</p><figure class="kg-card kg-image-card kg-card-hascaption"><img src="https://tinybird-blog.ghost.io/content/images/2023/11/create-pipe-min.png" class="kg-image" alt="A screenshot of the Tinybird UI showing how to create a Pipe." loading="lazy" width="1600" height="1015" srcset="https://tinybird-blog.ghost.io/content/images/size/w600/2023/11/create-pipe-min.png 600w, https://tinybird-blog.ghost.io/content/images/size/w1000/2023/11/create-pipe-min.png 1000w, https://tinybird-blog.ghost.io/content/images/2023/11/create-pipe-min.png 1600w" sizes="(min-width: 720px) 720px"><figcaption><span style="white-space: pre-wrap;">From the </span><code spellcheck="false" style="white-space: pre-wrap;"><span>flight_bookings</span></code><span style="white-space: pre-wrap;"> page, click "Create Pipe". Alternatively, click the "+" icon next to "Data Project" in the left navigation panel.</span></figcaption></figure><p>Name the Pipe <code>airlines</code>. Then, in the first Node, paste the following SQL:</p>
<!--kg-card-begin: html-->
<iframe width="100%" src="https://snippets.tinybird.co/XQAAAAKLAAAAAAAAAABBKUqGk9nLKurOBXL5keMH5ZlUF0XuhjOSC-D7p0Vg6D10v5k_KY4RLLNBFYEjuOt5zEkWsdp6YRTW2nEnJPO2U9_Le11JtUbGShGWRzuG3rejifYU1JxUViTgjH-JjUF1Qa27zb1NDQIwXXaF39-bG6s6xj62voHJts-X__6hOAA/embed"></iframe>
<!--kg-card-end: html-->
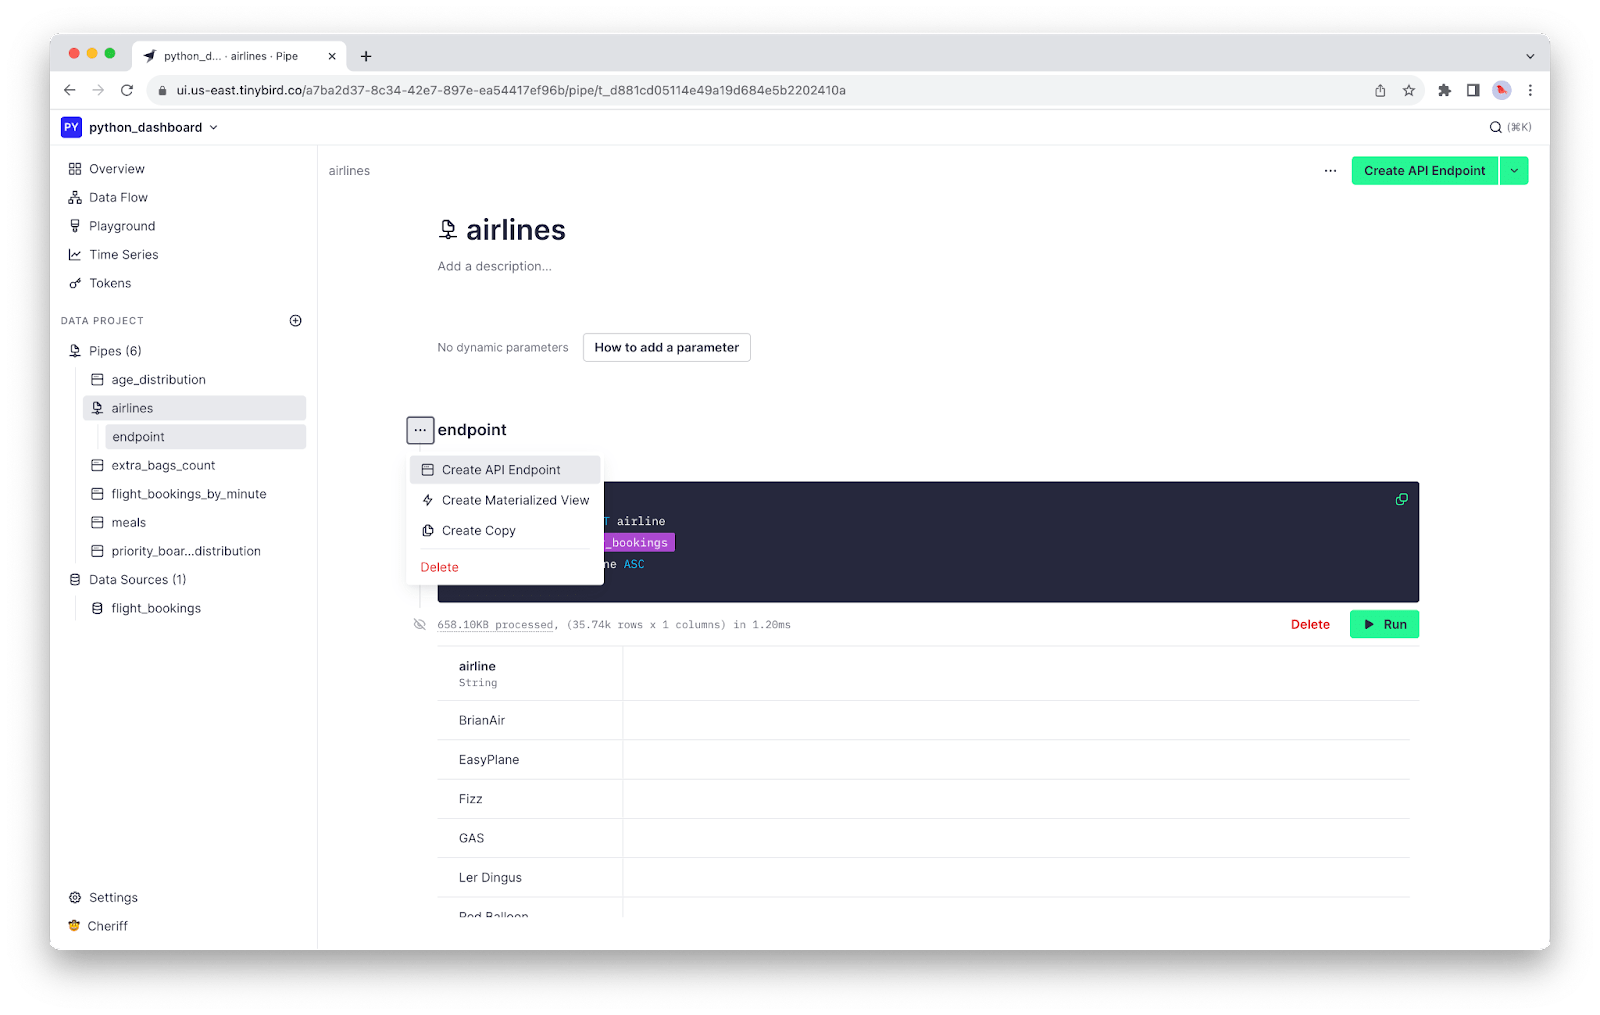
<p>This will return a list of unique airline names in the data set. Now, let's publish it as an API. Name the Node <code>endpoint</code>, then click the Node Actions and select "Create API Endpoint": </p><figure class="kg-card kg-image-card kg-card-hascaption"><img src="https://tinybird-blog.ghost.io/content/images/2023/11/airlines_api-min.png" class="kg-image" alt="A screenshot showing how to create a REST API from an SQL query in Tinybird." loading="lazy" width="1600" height="1015" srcset="https://tinybird-blog.ghost.io/content/images/size/w600/2023/11/airlines_api-min.png 600w, https://tinybird-blog.ghost.io/content/images/size/w1000/2023/11/airlines_api-min.png 1000w, https://tinybird-blog.ghost.io/content/images/2023/11/airlines_api-min.png 1600w" sizes="(min-width: 720px) 720px"><figcaption><span style="white-space: pre-wrap;">Creating an API Endpoint from an SQL query in Tinybird is as easy as clicking a few buttons.</span></figcaption></figure><p>You'll be showered in 🎉 confetti 🎉 as you revel in the automatic generation of your first real-time data API!</p><h3 id="create-the-remaining-apis">Create the remaining APIs</h3><p>Now that you know how to create an SQL-based API in Tinybird, let's speed through things and generate the remaining five. From the <a href="https://github.com/tinybirdco/real-time-python-dashboard/tree/main/data-project/pipes" rel="noreferrer">GitHub repository</a>, download the six <code>.pipe</code> files and add them to a <code>pipes</code> subfolder in the <code>data-project</code> subdirectory of your project.</p><p>Your project directory should look like this:</p>
<!--kg-card-begin: html-->
<iframe width="100%" src="https://snippets.tinybird.co/XQAAAAJAAQAAAAAAAABBKUqGk9nLKwEE-uHdo4yrq3_75nByF0MSq6AppU5XuJ9V8Y7AD5JQ1mTx_KbS0eEbdmMUu9ojBV_SwPC3_9BnnLG0DDXCz-NShKNYCRX6tSya90ea9AvsH9aLbGCeZKeEdfY7cMun8LN8R58G5gATGj5DN9sZj58H2Uk5s6W4uaTGGPBlqFO9d0_phY7xM0pmNMHH5fIJ4Bi060AcCYtH5Qd3dyYXEGekX9AS5YxhldwUC6HHdiiMsb6iEEu_q0fs6f__8feWwA/embed"></iframe>
<!--kg-card-end: html-->
<p>From the <code>data-project</code> directory, run the following command in your terminal:</p>
<!--kg-card-begin: html-->
<iframe width="100%" src="https://snippets.tinybird.co/XQAAAAJsAAAAAAAAAABBKUqGk9nLKzhOVoYh_ja8kYrE55JrpUbulZ9atm32hMUHDmXFt6loSp5fm70qunkoHwARjVyqzpoZN8xSZLl2CYnX58Qm2UMvUfdQLgTbEurobX7FV6ZicJ3S3C0HoI6Q4Hf__mVsAA/embed"></iframe>
<!--kg-card-end: html-->
<p>This will instantly create five additional API Endpoints that we'll use for our real-time dashboard. As new data streams into Tinybird, these APIs will update in real time with the freshest analytics.</p><h3 id="a-note-about-query-parameters">A note about query parameters</h3><p>In your Pipe definitions, you may have noticed some curly braces, like in this first node from the <code>flight_bookings_by_minute</code> Pipe:</p>
<!--kg-card-begin: html-->
<iframe width="100%" src="https://snippets.tinybird.co/XQAAAAJFAgAAAAAAAABBKUqGk9nLKwdmDenf6-E5pANGE844WKnWb5V_LXSuvJfS5hX6UQlvbQ9Yfjk7JESSiBGVuBRz-pOBQEo6PiRRK_3uz_5q26nccQoVI38Tf60g0GEWdr8acNtyySjAXZR6T-S8cfNOiS08dadxPS-lFFBIPOawJOojMiyuh7xz_1Dn_Yy9VEZDObGmtGj3JADVmOSv32o5lcrHA1EEoLfwOjzVopFAM_bOqfVbYGJKgI4C1fZxZOQ-sQtPlIq_bNeyCH2WKesJCXuoxy6yy7Ubn0S09Uf9MT8LKZM5dWwwPhiNnOWE0CjJppQNNN2INDbm---ovDB0hfRxpU2UIv6sXk0R05ikQdgNs-U9cqjfmYSpy6n3KDQS4NU_KTLemAI-CvC1hHuMte8NDDbSbWA7KZK_YUQUw6UI3-HSoX6GV2EpDdYLqaMUbU2W4QlVlBv1DqPP5P7oPN2XqIVCrXJjFxyM3TyU__GrNvc/embed"></iframe>
<!--kg-card-end: html-->
<p>Tinybird's <a href="https://www.tinybird.co/docs/cli/advanced-templates.html" rel="noreferrer">templating language</a> allows you to add <a href="https://www.tinybird.co/docs/query/query-parameters" rel="noreferrer">dynamic query parameters</a> with advanced logic to your APIs. In the node above, which is the first node in the <code>flight_bookings_by_minute</code> Pipe, you'll find 3 query parameters:</p><ol><li><code><strong>lookback</strong></code>: A UInt16 that filters out data that is more than <code>&lt;lookback&gt;</code> hours old</li><li><strong><code>airlines</code></strong>: An array of airline Strings that allows filtering by one or more airlines when defined</li><li><code><strong>meal_preference</strong></code>: A String that filters by selected <code>meal_choice</code> when defined</li></ol><p>We'll use these query parameters in our Dash app to create dynamic filtering in the real-time dashboard.</p><p>With these API Endpoints created, you're ready to move on to Step 4.</p><h2 id="step-4-create-your-dash-app">Step 4: Create your Dash app</h2><p>Now that you have your data APIs, you can start building your dashboard. Our dashboard is going to have a time series line chart, a donut chart, and two bar charts. To get started, let's go ahead and lay out the structure for your dash app.</p>
<!--kg-card-begin: html-->
<div class="tip-box"><div class="tip-box-container"><div class="tip-box-title">Want to skip ahead?</div><div class="tip-box-content">Feel free to download the pre-built <code>app.py</code> file from the <a href="https://github.com/tinybirdco/real-time-python-dashboard/blob/main/app.py">project GitHub repo</a>. If at any point you're confused about where to add code in this file, refer to the repository.</div></div></div>
<!--kg-card-end: html-->
<p>From your project root, create a file called <code>app.py</code> and add the following code:</p>
<!--kg-card-begin: html-->
<iframe width="100%" src="https://snippets.tinybird.co/XQAAAAKDAwAAAAAAAABBKUqGk9nLKvK8JEfvgmJny0tZ_VzUu0fkIGRarFWuIP_LfNy4e0V8gGw56Fy0gIhw01_BUu0TaX82bY5NI7h9zhqfB_szpRVDsXtXKuap53I5mup9S-tkq17xrF9tv_Iithaas73bGz2QtS-xGNMSfp9r9YEtdKs_GwyNOGciMX1EPkym6uxIwJZtGx0nmrkMoHDzCcNdEyyGUAAttFJsmMKEtQJ0Vt9Bd4Nws9pQzLT-5did_fNTKWgvXLgYcfsIajUwQYX_0yVDUpTPEHxkxG_TfWuIc3J_N86edKd6X9PsptXck426SYomxBo9K1ThVLksMeXyn3waiuFcOXbmGyUxfOvsM8PgvUVXB25Bf7M0mEiacSmU4xuD4FI5D-bjkxdn0PkquNrp1aPKEccw3HAsdV8BNRX-Xu1DW8Hazc3Fc0lDAqAhsonYIC2JQugV3B42f_7kJEA_D8pCJINVaRVvutCVjsvyNFcyLORgefD5EApbAgro_M2yka8AwMADMXB2EzZ20YvgF8S_VbN9UutPPgZovbmgvITCb1BhTjBdsgZPCxaZAj4EV9T4h4vuCW1CUCDu65CNYuCnDvciQd_0RCL8UdfpE0EBQbwzaAUlD7u0e-1A9_qAaTl7OJN55Ewmd2dn9Lu2cv1ihT4gQbJj-FCoXnL1JIBTHneUB4n4fZmhfMrLrJyQPtCZVlAnMUTU40SjanHyBfQs2sGixjjkOAcRgW6HM3FBVYMgZgD5NT_Krmnqxqlp8V60VEuV44hlIQY49_ym-J8/embed"></iframe>
<!--kg-card-end: html-->
<p>This imports all the libraries you need, creates your Tinybird client, and initializes your Dash app layout. Now, let's add some charts!</p><h3 id="set-up-tinybird-api-definitions-using-verdin">Set up Tinybird API definitions using Verdin</h3><p>Since we're using the Verdin SDK, it's pretty easy to create Tinybird API definitions. Let's start by defining the <code>airlines</code> and <code>meals</code> APIs that we'll use to populate our dropdown options.</p><p>Add the following code below where you initialized your Tinybird Client (outside of the app layout):</p>
<!--kg-card-begin: html-->
<iframe width="100%" src="https://snippets.tinybird.co/XQAAAALDAQAAAAAAAABBKUqGk9nLKw2yfldDXvVbe_moUMTj28QdOgD2l14VyJ2EwxckB6ryQI_qNTWqg3ohbtQPh9WY_wXFylXQD2uIhbUi1bmrB_kdmNVNke3woOG_0WHxnPFozgeRmV7s-mxpaqBaezWyNTaFzNdNY6TEipbtW--wuCd86hFVZAVE3JHMcwBxfUuocKwtx4DUxas16MCoT38_HAzz58Ulp25VyYNBZpwxKP7Wqdecnh8e1LOvbN7xZstcDhfxSVskXdkeHkv0-bEoVvm-BSZRpEy6gF491gJhOaYmTia96NSlea6warbs6xnKzNAPletMOiQc8xVyvudvRBLU0GboAIFyt-zMmXb__-5wuoA/embed"></iframe>
<!--kg-card-end: html-->
<p>Then, go ahead and add the remaining API definitions (the ones you'll use for your charts) below:</p>
<!--kg-card-begin: html-->
<iframe width="100%" src="https://snippets.tinybird.co/XQAAAAJcAQAAAAAAAABBKUqGk9nLKwKYU_e1xgmDGAb_RGMl8e6V3_31-Bz7iTpNksQpNPkUhLvrs6D4CwQKOqrYCIFTN5h4Yy7YDvyaKiPdlu4wrvWJl8gqSSdq6uOQfJVO_4f7K_BDSUMSqOi8qnLDh5IZKcTUHnJbvbSY7P3wKcklaDMKUc3689trz7rkh6nSlXWTzM9ubSkDk8oVmVwkFZs8ZzzwCFhDQcpLkIgyHqXRpujOQ-F1XxrdkaO9tA3yxVA_SUPGH_-asmdA/embed"></iframe>
<!--kg-card-end: html-->
<p>With your APIs defined in code, you're ready to start building the real-time dashboard components with Dash.</p><h3 id="create-a-title-and-div-for-inputs">Create a title and div for inputs</h3><p>Let's add a title to the Dash app and a <code>div</code> to hold our input fields. Add the following to your app layout:</p>
<!--kg-card-begin: html-->
<iframe width="100%" src="https://snippets.tinybird.co/XQAAAAIeAwAAAAAAAABBKUqGk9nLKwqGcli6jsL8ckbAEm38-3YGntHPTbrNeNJd7y30eyvnAZWHTETTWkBeFVWwSK78L52qZ1rrZgk1w1WRjnzmGg_YVuo88uIuHVKWQ64B9Gf_ezDhGhsNplozI17iceUNaXBigZ0nkgDdgZNQKThKtbTIdTuA-qf4ZAKXeAKoFDX6YQWr-ZdggYLNa1tAcY-odA03DRKmjTWHhQstYQBTs06DYpWUv_tWsQDOvt8yzZb7V0AuMVMnTn1IbIi0Vey5aOFzAkHHLnkQtOTDj5yIIxJ42i8FvaBRNgqPh84sRKxGhdCc7W8wRrZqIB0HY6t9wsPBx8zKvazFOVjqF8zT81HTj3CCRiGzSleOgVcqApjbjvI-TZFLpv6HbUDE-ToQNBBWS45c9jR4wxZ6raUrXiF7vlwS6nVLPIaE1yVbS0KgNfrwy5kdFErPAjM9iy02oxwt62kF4yPLkxKzuZmrTE3ZtUM0jv__5iF_Sg/embed"></iframe>
<!--kg-card-end: html-->
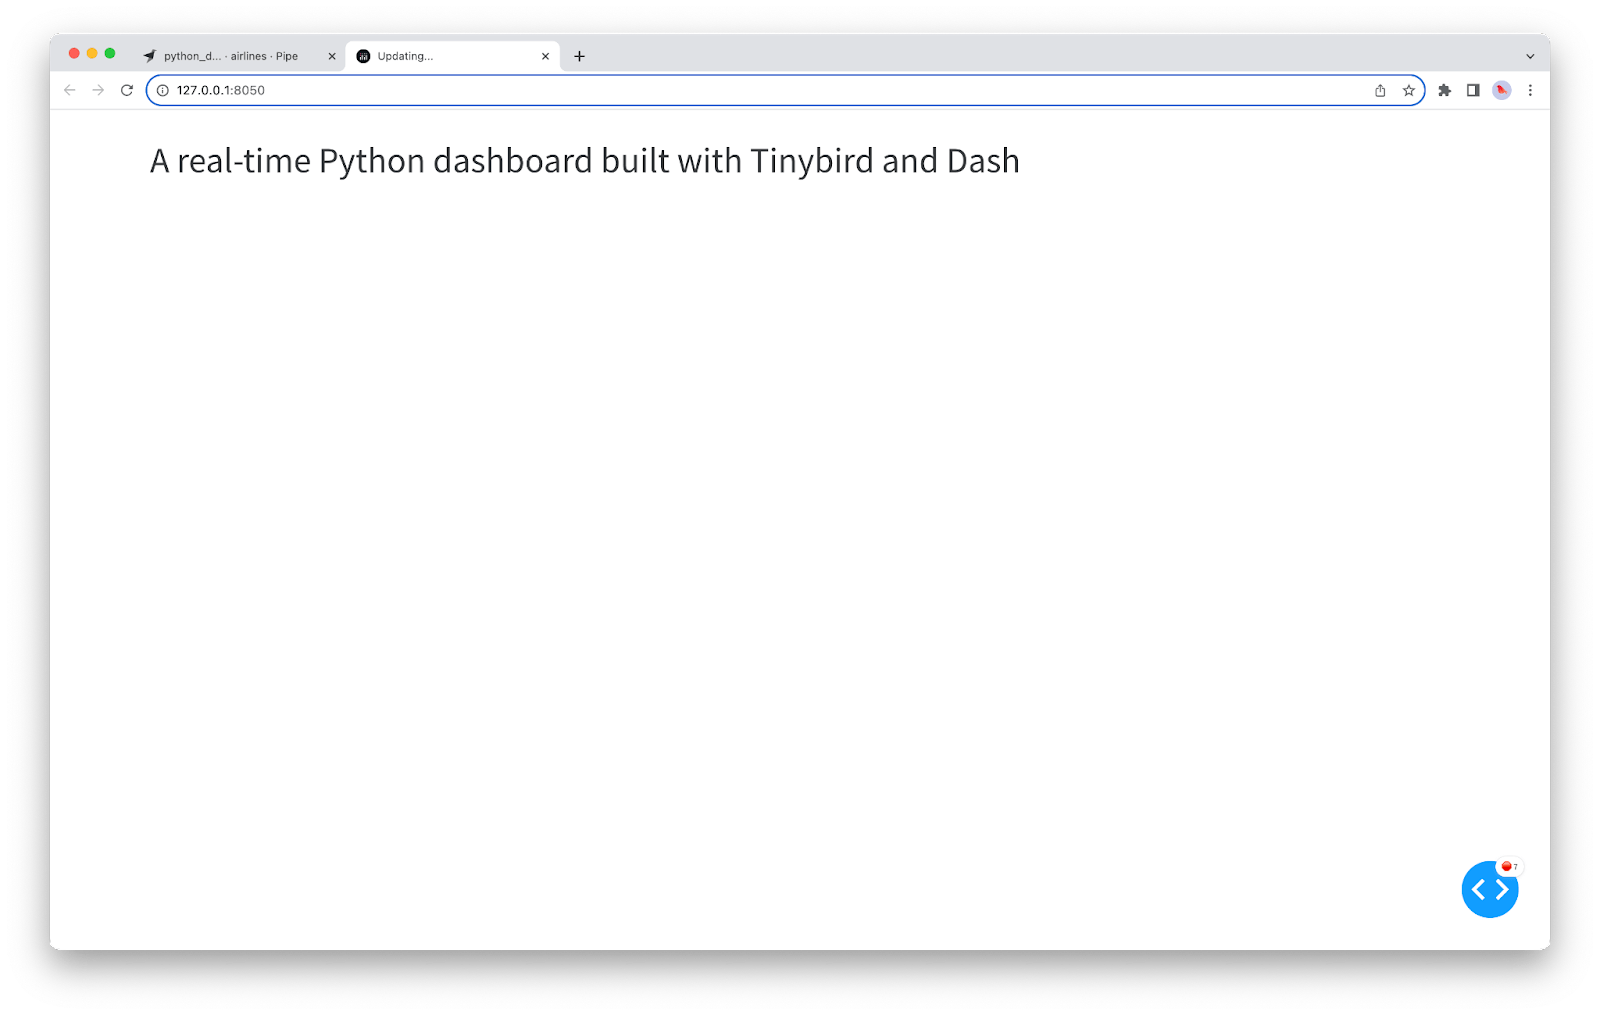
<p>If you run <code>python app.py</code> and open your web browser to <a href="http://127.0.0.1:8050" rel="noreferrer">127.0.0.1:8050</a>, you should see something like this:</p><figure class="kg-card kg-image-card kg-card-hascaption"><img src="https://tinybird-blog.ghost.io/content/images/2023/11/title-min.png" class="kg-image" alt="A screenshot of a real-time Python dashboard skeleton with a title that reads &quot;A real-time Python dashboard built with Tinybird and Dash&quot;" loading="lazy" width="1600" height="1015" srcset="https://tinybird-blog.ghost.io/content/images/size/w600/2023/11/title-min.png 600w, https://tinybird-blog.ghost.io/content/images/size/w1000/2023/11/title-min.png 1000w, https://tinybird-blog.ghost.io/content/images/2023/11/title-min.png 1600w" sizes="(min-width: 720px) 720px"><figcaption><span style="white-space: pre-wrap;">We have a title and an (invisible) inputs </span><code spellcheck="false" style="white-space: pre-wrap;"><span>div</span></code><span style="white-space: pre-wrap;">.</span></figcaption></figure><p>Let's add some dropdowns. Here's what the dropdown definition looks like to allow people to select an airline:</p>
<!--kg-card-begin: html-->
<iframe width="100%" src="https://snippets.tinybird.co/XQAAAALHAQAAAAAAAABBKUqGk9nLKwXEYxODa8l6rtGEgSL4YRz337yv8yDyA6kt38HkAGmcyjt71cVV8Mw70KOKIyJJOn2TxqAZSyHbwepU4gEvDxxZnaQBAN-HJh1CxlgeAVqxW7kI7zJ52ZoC_6kQsUVfIxEn7A1OZVablCVmAbEiUhXHjQ1IFCAiSb471D4ulSmBaf45Ax87XCMIeTEV3t33bkg81TYdmZZqwChZF-c5zkodnTMInNmI0co7WU3CktxrSFfvZqj2auJnkuhLB5RyeIpsQXU7d3lRcJROXTxpBjxeNcdr__8Wa-AA/embed"></iframe>
<!--kg-card-end: html-->
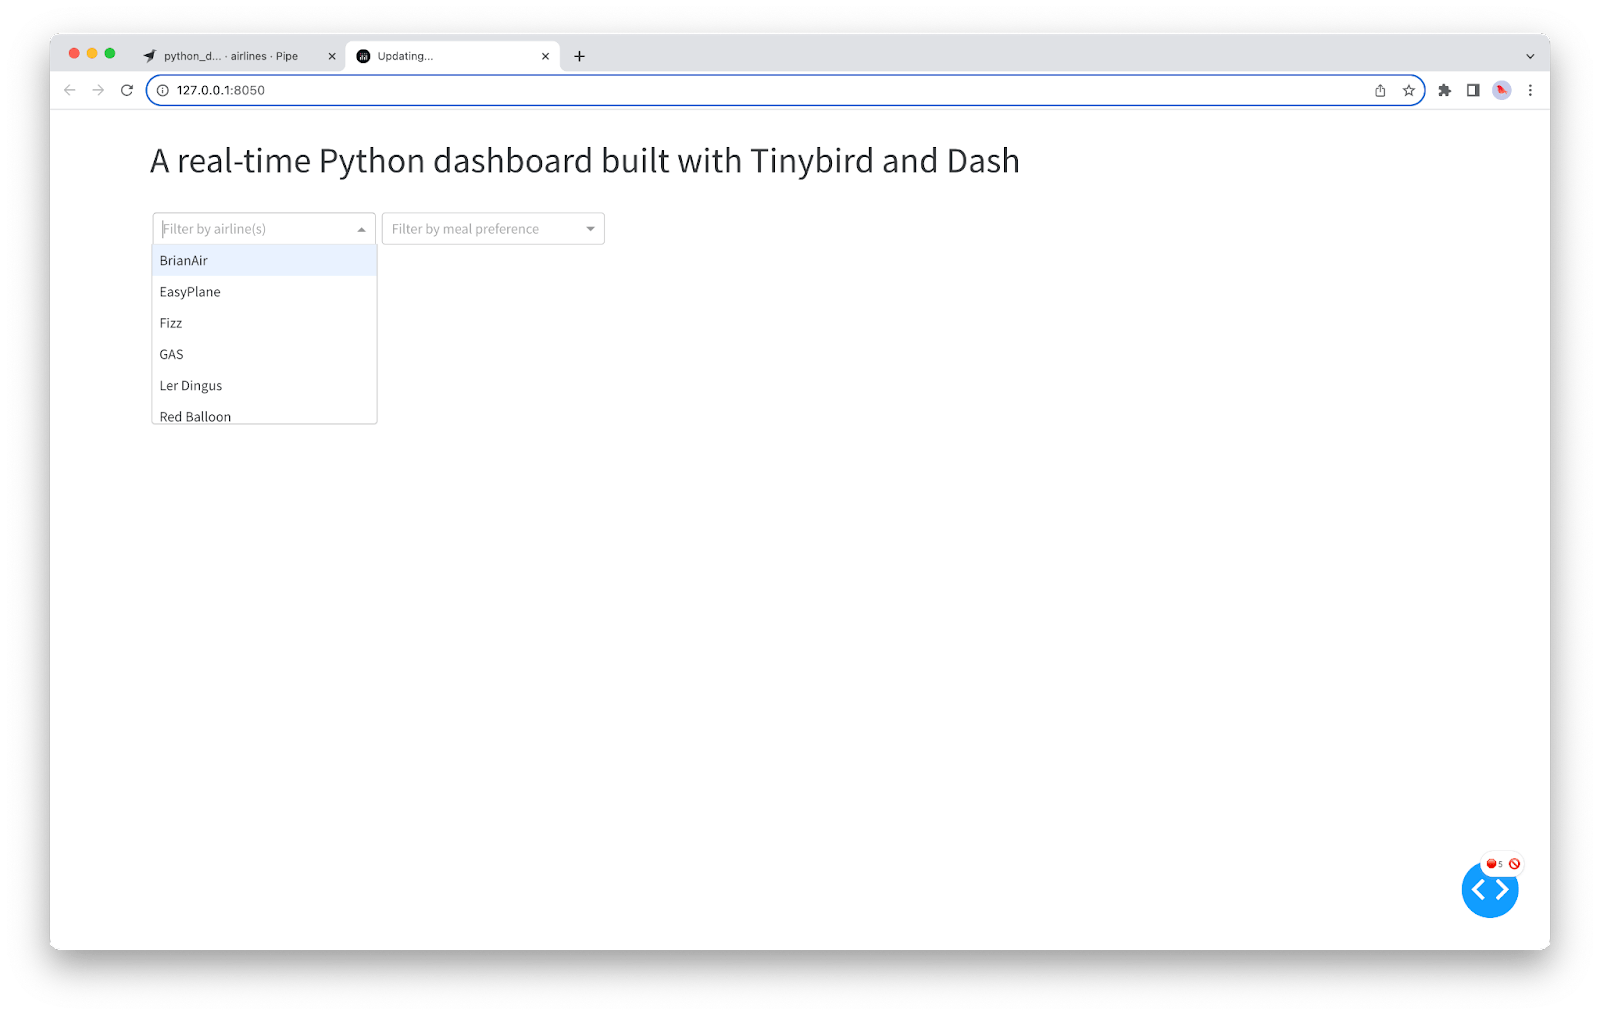
<p>You can see we are using the <code>airline</code> column from our <code>airline_options</code> DataFrame to populate the dropdown options, multi-select is enabled, and we've added a placeholder and some CSS styling. You'll want to add this in the <code>children</code> list parameter for the encompassing <code>html.Div</code>.</p><p>Let's go ahead and add another dropdown for meal selection</p>
<!--kg-card-begin: html-->
<iframe width="100%" src="https://snippets.tinybird.co/XQAAAAKsAQAAAAAAAABBKUqGk9nLKwwnM83cmzsH_FPudU9CfEpaqvc-0ucjUcEc2FGUYRdGTJUcw0Nbr58UqMiCzgWuqxxlI2JbMbVSZaDORnKNFoC4H0IOOBnjOq9bxs2ss61588-SJqLogc4siY2KDR1anLFQf-uJakZG5PHaMwcURAC9uN0XK3R3kHUdDg17Lz0DR3YYLINcXP296GZBr716LbpOIBIvNkwaV8UUuO52bNXiGT7pGlWHiBeJOiRg_XrboGa0sy_54xc4J4d_zIFMI7AxdiUz8VjAwXuLLOhE6lUzDeP__SxOiA/embed"></iframe>
<!--kg-card-end: html-->
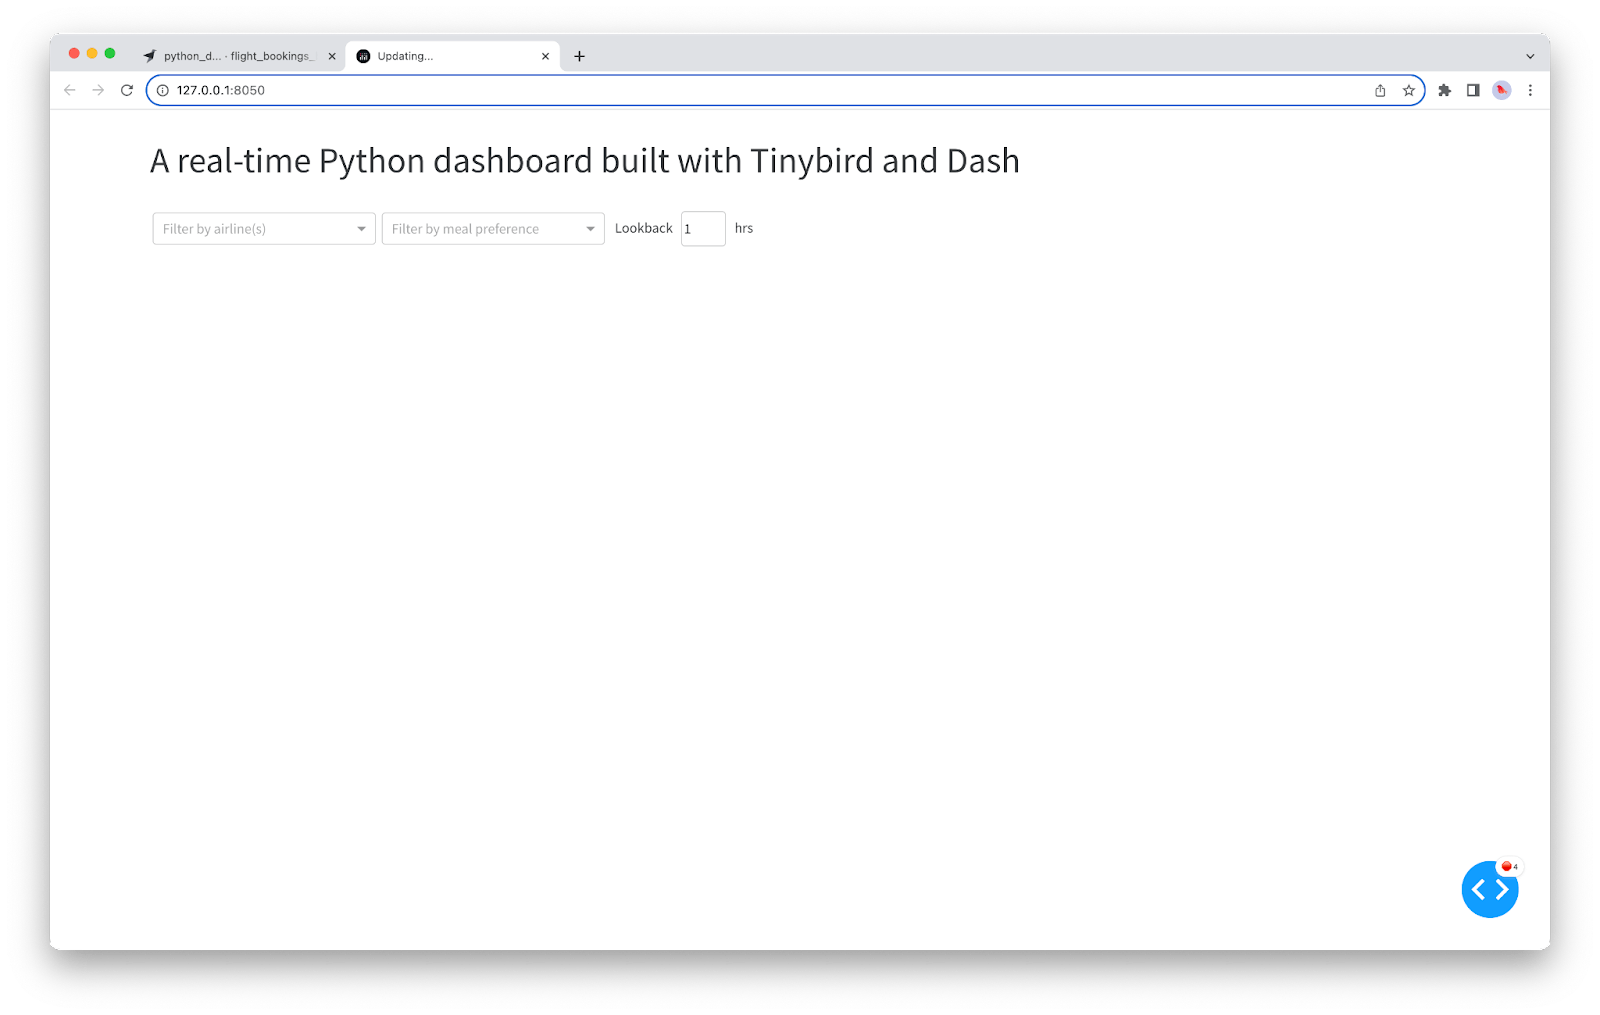
<p>If you save and run your app, this is what you'll see:</p><figure class="kg-card kg-image-card kg-card-hascaption"><img src="https://tinybird-blog.ghost.io/content/images/2023/11/title-dropdowns-min.png" class="kg-image" alt="A bare bones real-time Python dashboard with a title and two dropdown components." loading="lazy" width="1600" height="1015" srcset="https://tinybird-blog.ghost.io/content/images/size/w600/2023/11/title-dropdowns-min.png 600w, https://tinybird-blog.ghost.io/content/images/size/w1000/2023/11/title-dropdowns-min.png 1000w, https://tinybird-blog.ghost.io/content/images/2023/11/title-dropdowns-min.png 1600w" sizes="(min-width: 720px) 720px"><figcaption><span style="white-space: pre-wrap;">We've added some dropdowns!</span></figcaption></figure><p>Lets add one more input to dynamically change the lookback period, along with some labels:</p>
<!--kg-card-begin: html-->
<iframe width="100%" src="https://snippets.tinybird.co/XQAAAAJHAwAAAAAAAABBKUqGk9nLKvRcAGjpz7XQ7gR_9m5BJmVFt_dwAsg9lY_6obUNXnVLb2Hg_1BcLy9_-UKa6wE1DUCOddWqIRy8RdygUQOm_rH8fSt3KTYx3vo0_7-fEpG1b0nrl1aWaKIAqm5xRqJWdQwqUbB2ZTFSrwbIQBV1PCQm9g54LNblMrQDUi-gu_aWZdk1_LsboCyJMGP3IQdpLeHxoBpG-O6OH8zX-W5BcOhwR1r9JOqBKD4wOXJMPvMIx-l0_ks3IGfFlNK_zctzN3-KI33PJya1Qej8WWxKIRXvuauJKkhMa8HpB5qluVvgDyO-ShMdoPdcXERgWf9miWuErl6WhXghK2DZOlnPonC2Ok3X_Np7zBBEu34pV2CVy2FqLKxNjD-F8kzjrQNqIwFMh6mFw__51tzd/embed"></iframe>
<!--kg-card-end: html-->
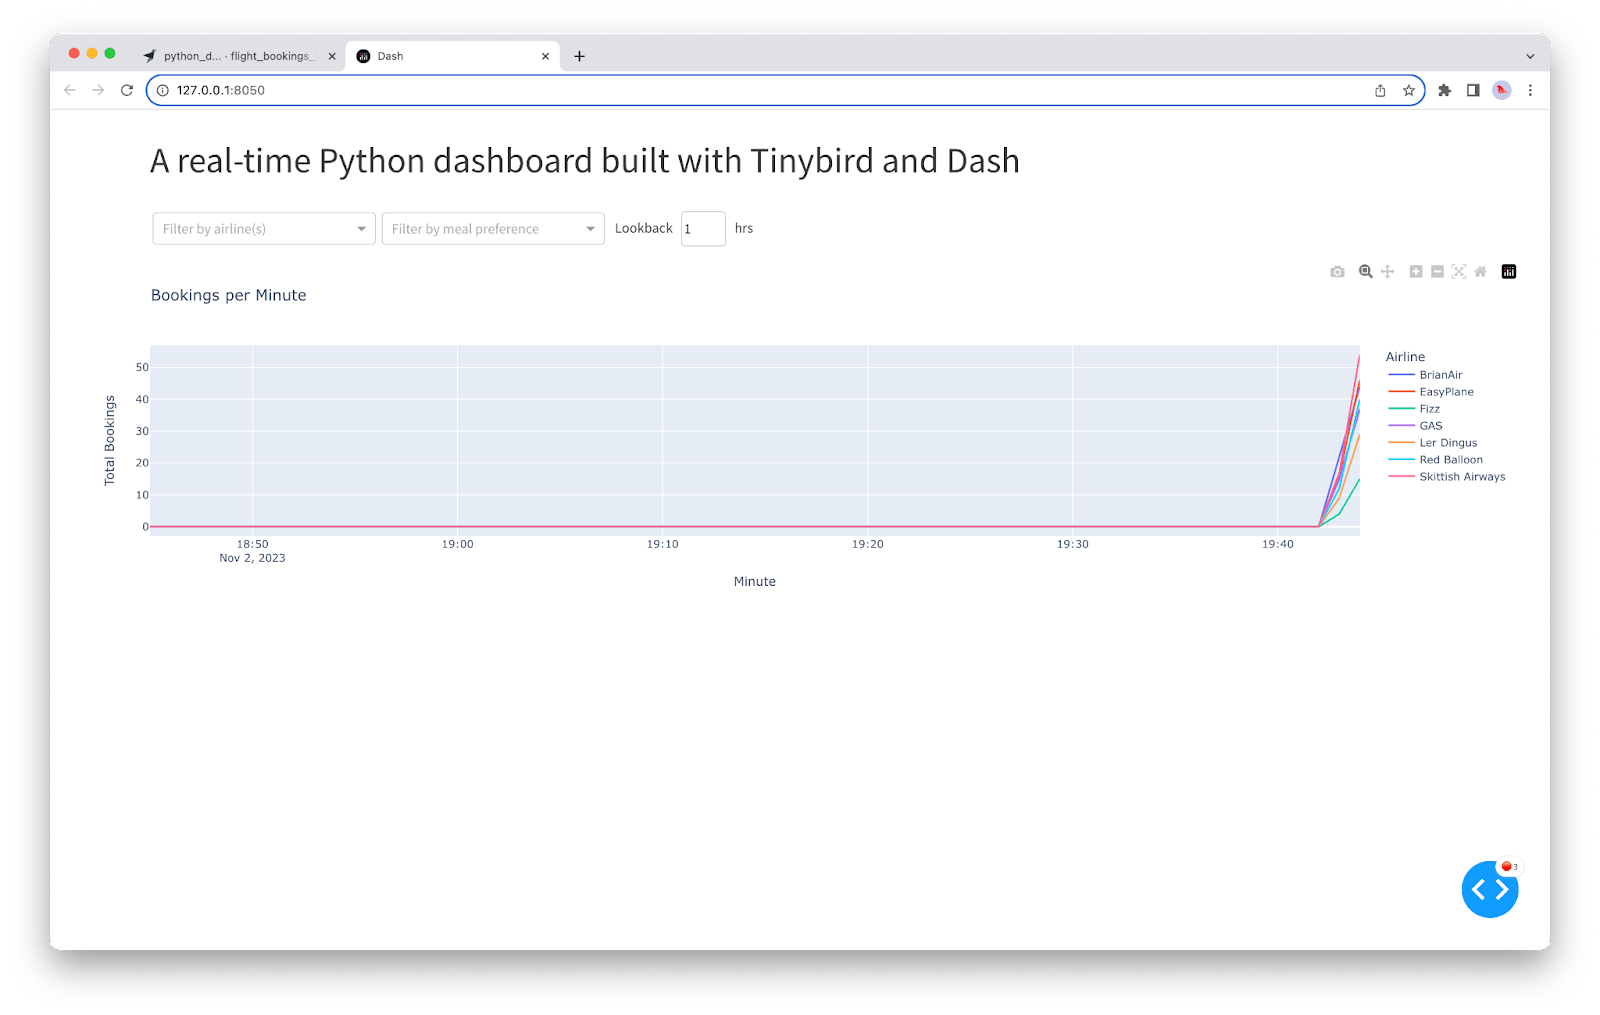
<p>And now, your Dash app looks like this:</p><figure class="kg-card kg-image-card kg-card-hascaption"><img src="https://tinybird-blog.ghost.io/content/images/2023/11/title_inputs-min.png" class="kg-image" alt="A bare bones real-time Python dashboard with a title and 3 input fields" loading="lazy" width="1600" height="1015" srcset="https://tinybird-blog.ghost.io/content/images/size/w600/2023/11/title_inputs-min.png 600w, https://tinybird-blog.ghost.io/content/images/size/w1000/2023/11/title_inputs-min.png 1000w, https://tinybird-blog.ghost.io/content/images/2023/11/title_inputs-min.png 1600w" sizes="(min-width: 720px) 720px"><figcaption><span style="white-space: pre-wrap;">Added an input field for the time lookback</span></figcaption></figure><h3 id="add-your-first-chart">Add your first chart</h3><p>The first chart we'll add will be a line chart, showing the total number of bookings per minute grouped by airline over the lookback period. This uses the <code>flight_bookings_by_minute</code> API we created in Tinybird.</p><p>Add the following code below the div containing your inputs:</p>
<!--kg-card-begin: html-->
<iframe width="100%" src="https://snippets.tinybird.co/XQAAAAKKAAAAAAAAAABBKUqGk9nLKv3Y7uFpCnvK1alxtdua-PuQ2yu0VMTzT4ZT6IJ_PqejkwPKDF-QnPRdNvqheIJyFKdCETg-N3hen4eS3KZasEMDHUtqxD5mRhykl1Hz7lsQFmuDdpo4QnoQY90L2A60IhuiHFlgAqRCAesXxvJZXJPGbA7E4RSPIAmv__3RwAA/embed"></iframe>
<!--kg-card-end: html-->
<p>This defines a Dash Graph component that we're calling <code>bookings-chart</code>. Now, we need to add a callback that updates this chart.</p><p>Below your app layout definition, add the following decorator:</p>
<!--kg-card-begin: html-->
<iframe width="100%" src="https://snippets.tinybird.co/XQAAAAL8AAAAAAAAAABBKUqGk9nLKvqr_esBp6JqW9r14szM2CD9aHpt7-TPQZvIlB4jJgKwWRoSaAepZ3Yzt5l12WB5ww8NwssHzHdCtKG7dblnzbWtFDeu-lSI9N3Qu4VR_4T1IaDJwOTGVg5KShT23C1uh-2MmvjLqR8aSGV-g-Afo7LxrLY-EPQiUlj7Suas69gR9JlebQVD7kv936jKfrDKQ_b3KmMoS2vrwS4Erfsz6X4r_q2rgA/embed"></iframe>
<!--kg-card-end: html-->
<p>This will call the succeeding function and update the <code>bookings-chart</code> anytime an input filter is updated. Below the callback decorator, add the function to update the line chart:</p>
<!--kg-card-begin: html-->
<iframe width="100%" src="https://snippets.tinybird.co/XQAAAALAAgAAAAAAAABBKUqGk9nLKwRAtWRgLJZJ-ZveDlUwphMWgXnKDUtZDFp6WI48FIkDqJmtZbIMNAj0FJpQ5ASLX6upT9sxNnXwZC2GbIeie3sPUhdopKV78JTAzzPdnvUv_JJgvVxdm2ABIoFQetqMOkVxLvRQmfTyJVrm4xyhjmQg5vB1-1SV0a_KVnixwTlODK-aplmC6UlW0wn7q8xSUAYx6K9G3b6qMHm7hU_oE-LcsMBINI6Fg52fZC4WFYFCk2u_sCdNbzEu2Pq394tncK172aubbZR5xDesG-AyH-LX43hsdCrXTxJvKkgay_ECWF0d66uFwuZEJnbm-xzwzPPM56pUWTdO6jreZv9GetTrWG5k1IIebuecZpQmU1BMMovYtIbTOOYkkLh3-mQUF8YlK9iWXydtl5mGZfRL9rKgZwH1JDqS31fvUuEP4MK2XFJJUTVKejQE22u87glIibA-2Oyu8BEV9x3EXba0jsUM_vR0wfM/embed"></iframe>
<!--kg-card-end: html-->
<p>This function passes the selected airlines, meal preference, and lookback from the inputs to the Tinybird API, then creates a DataFrame from the data in the JSON response, and returns a Plotly Express line chart using that DataFrame.</p><p>Save your <code>app.py</code> and run it. You'll see that you have data!</p><figure class="kg-card kg-image-card kg-card-hascaption"><img src="https://tinybird-blog.ghost.io/content/images/2023/11/line-chart-min.png" class="kg-image" alt="A real-time Python dashboard with 3 inputs and a line chart showing some data about flight bookings per minute grouped by airline" loading="lazy" width="1600" height="1015" srcset="https://tinybird-blog.ghost.io/content/images/size/w600/2023/11/line-chart-min.png 600w, https://tinybird-blog.ghost.io/content/images/size/w1000/2023/11/line-chart-min.png 1000w, https://tinybird-blog.ghost.io/content/images/2023/11/line-chart-min.png 1600w" sizes="(min-width: 720px) 720px"><figcaption><span style="white-space: pre-wrap;">Your dashboard is now connected to Tinybird's real-time data APIs.</span></figcaption></figure><p>As you make selections from the dropdowns or update the lookback period, your Dash app is making requests to your Tinybird API to get the freshest possible data at very low latency.</p><h3 id="add-a-refresh-interval">Add a refresh interval</h3><p>Of course, we want this to be a real-time dashboard, so it should refresh periodically as new data arrives. How often it refreshes is up to you, just keep in mind that every refresh will make additional Tinybird API requests, and you get 1,000 daily requests on the free plan, so I recommend something like a 60-second interval for starters.</p><p>To add a refresh interval, first add an <code>Interval</code> component to your Dash app definition by adding the following code below your <code>Graph</code> definition:</p>
<!--kg-card-begin: html-->
<iframe width="100%" src="https://snippets.tinybird.co/XQAAAALQAAAAAAAAAABBKUqGk9nLKwdputnUB1_-BfyqxeFhfVMg5tp0tIkKDjI81FcHYb_l3LSyCL2nd4ErAxfzX7C60RJ4cu7LgUp6S2Ev4vaekXlGxnhK-H4TPTamNivGZfbJSwLjK7kzHMsJd9RSLUzqrzrzQAXrbu2xUwSJFMRL8tVMrwsz2DpJhlmb_v38QeA/embed"></iframe>
<!--kg-card-end: html-->
<p>Note the interval is in milliseconds and setting <code>n_intervals=0</code> means the refresh interval will run ad continuum.</p><p>Then, add the interval to your callback inputs:</p>
<!--kg-card-begin: html-->
<iframe width="100%" src="https://snippets.tinybird.co/XQAAAAJHAQAAAAAAAABBKUqGk9nLKw9Ig_e12pGuz9wXyyWr_X6JgrFXf_ZMP75-1kIXhn-AdHAnvXopiWPf_xlh7zI7jNxGdoFuQl_auS_XFfgmvKp8aSv1SX5T9v1-ax9Ro990flTk0lqqUXkvHThk71VSeKaBoONCCLlpUrE60-JTIN001tDmBKw0nOHrfhy6FEhOL1S-m8wdKV-20loU02ji5iehjtEFhBzV6JzazyHlCHS74JazPSnWjWC6aroEsPyoY7VHI01d_OWEwovRTZdjrOdvhw3j_808T8DgqP_uBFnT/embed"></iframe>
<!--kg-card-end: html-->
<p>Finally, add an additional parameter called <code>n</code> to your callback function so it doesn't get angry (you're not actually using this parameter, it's just needed so the function matches the decorator).</p>
<!--kg-card-begin: html-->
<iframe width="100%" src="https://snippets.tinybird.co/XQAAAAKkAAAAAAAAAABBKUqGk9nLKwXEX_e17HFHcKoFU0qXtB5qUboYrowARaiYQ1RMAFpWUfk1QomMyJFA69RpX1JsHHNAldkdJvlbZZdzg85tJGlvytLhvh_i1AQ9ZkI9PHEqtIa8RsG0i9pGDlx_59FcLfJgxApKyi0thq9D976tmZbbRPjdVkdzu3xB-_fn5XJt3iy47X5P2t0f5ipU57Wayv__TdXAAA/embed"></iframe>
<!--kg-card-end: html-->
<p>Now, your dashboard will automatically refresh every minute.</p><h3 id="add-the-remaining-components">Add the remaining components</h3><p>Let's round out this dashboard with three additional charts. Add the following code below the <code>Graph</code> and before the <code>Interval</code> you defined previously in the app layout:</p>
<!--kg-card-begin: html-->
<iframe width="100%" src="https://snippets.tinybird.co/XQAAAAJ_AQAAAAAAAABBKUqGk9nLKwjwa_e1T3MobpRKc-AYaMsG0gExsarY7XjANX6F-XVkbSNWdKlSxZZbYqR8gL1-YH3WuqbyG-5JR1wcnSmTm2uCOzjT91SftXpEPqZJbx4AvcF4dBW6nwOT4Mf7eImjg4bPzO7wA6KrxVejR47xIavAksD40Xkt8MiiRpjoDuhvdmEo-pArZsnHriPHDzkkZMZok-SlDs0sJEspqsik-PJ8_agHWQtCEKpt-aUC9ZrNr_iulsBBDlBhFpFnCFs7IvKZr7bJEiPQcT9lljv8kgS5SopK3ioAHANb_rmR6BsR_5RFoAA/embed"></iframe>
<!--kg-card-end: html-->
<p>This will create a nice <code>flex</code> <code>div</code> that will layout the remaining three charts below your time series graph.</p><p>Then, we need to add callbacks to update those charts using the same filters and interval that we set up for the time series chart. For example, the age distribution chart:</p>
<!--kg-card-begin: html-->
<iframe width="100%" src="https://snippets.tinybird.co/XQAAAAKIAwAAAAAAAABBKUqGk9nLKzhVGwqLOubWKMuUvqGzvH8kSG3SjiXwG5pRrHYfQmaA-fIecexKh0cQ7YZKvpYFRGGgTaThlHnN8pyhK45Cpsqvr0TG6_noQxTD_tkEzmcEzS0DqNRrP__BoZ25eghoeF0rZd1EUAnCzSan8iGGO_QRkXcWhgNzKeF6MLIJdyztIUPF6qOj_CfzXwR6CNpo_6svTS48SAHBhUdDhNlu2JOGoNj9gDZ7P1_340KPKHDZQRMtTz3MU4NC9eBiPcHPfzS-Qu0-PuSX_7ZNyO3Z410TsiFVSwJYm9d2NPp-Iza-YgDv6Bz9atA_papRXUd-68WGIADGwBZAeHaAGhaYxf8UZaePJ9YeDqRjZESRAxNltYiBHTmMD9sEcyEEqsY-Kw39EBzfZEzTYpYiG-Mb2aH1O43ZU2EWflnzHekrKjOjoOS6SgTt2ul-VBMHDBzdSt-_HYqVKhDN8T8Um1_fkxeQliTdkoIAbPZTJFLcnMaZ_kaXuSkfLaFtD0SUXnhIStKCzJcABaVy7xK61IyZHk99M-5MDVErrkL24OwuAMkVuC3e_dr2OKnci9NDUsf2I-Em53zZPux0x5_MSzRIfB_UF2ehMfQ9b_n_JKmbAA/embed"></iframe>
<!--kg-card-end: html-->
<p>Go ahead and copy the remaining two from lines 147-200 in <code>app.py</code> in the repo. When that's done, save your <code>app.py</code>, and run it. </p><p>Congratulations, you've just created a real-time dashboard in Python with Tinybird and Dash.</p><p></p><figure class="kg-card kg-video-card kg-width-regular kg-card-hascaption" data-kg-thumbnail="https://tinybird-blog.ghost.io/content/media/2023/11/python-dashboard_thumb.jpg" data-kg-custom-thumbnail="">
            <div class="kg-video-container">
                <video src="https://tinybird-blog.ghost.io/content/media/2023/11/python-dashboard.mp4" poster="https://img.spacergif.org/v1/3360x2100/0a/spacer.png" width="3360" height="2100" loop="" autoplay="" muted="" playsinline="" preload="metadata" style="background: transparent url('https://tinybird-blog.ghost.io/content/media/2023/11/python-dashboard_thumb.jpg') 50% 50% / cover no-repeat;"></video>
                <div class="kg-video-overlay">
                    <button class="kg-video-large-play-icon" aria-label="Play video">
                        <svg xmlns="http://www.w3.org/2000/svg" viewBox="0 0 24 24">
                            <path d="M23.14 10.608 2.253.164A1.559 1.559 0 0 0 0 1.557v20.887a1.558 1.558 0 0 0 2.253 1.392L23.14 13.393a1.557 1.557 0 0 0 0-2.785Z"></path>
                        </svg>
                    </button>
                </div>
                <div class="kg-video-player-container kg-video-hide">
                    <div class="kg-video-player">
                        <button class="kg-video-play-icon" aria-label="Play video">
                            <svg xmlns="http://www.w3.org/2000/svg" viewBox="0 0 24 24">
                                <path d="M23.14 10.608 2.253.164A1.559 1.559 0 0 0 0 1.557v20.887a1.558 1.558 0 0 0 2.253 1.392L23.14 13.393a1.557 1.557 0 0 0 0-2.785Z"></path>
                            </svg>
                        </button>
                        <button class="kg-video-pause-icon kg-video-hide" aria-label="Pause video">
                            <svg xmlns="http://www.w3.org/2000/svg" viewBox="0 0 24 24">
                                <rect x="3" y="1" width="7" height="22" rx="1.5" ry="1.5"></rect>
                                <rect x="14" y="1" width="7" height="22" rx="1.5" ry="1.5"></rect>
                            </svg>
                        </button>
                        <span class="kg-video-current-time">0:00</span>
                        <div class="kg-video-time">
                            /<span class="kg-video-duration">0:16</span>
                        </div>
                        <input type="range" class="kg-video-seek-slider" max="100" value="0">
                        <button class="kg-video-playback-rate" aria-label="Adjust playback speed">1×</button>
                        <button class="kg-video-unmute-icon" aria-label="Unmute">
                            <svg xmlns="http://www.w3.org/2000/svg" viewBox="0 0 24 24">
                                <path d="M15.189 2.021a9.728 9.728 0 0 0-7.924 4.85.249.249 0 0 1-.221.133H5.25a3 3 0 0 0-3 3v2a3 3 0 0 0 3 3h1.794a.249.249 0 0 1 .221.133 9.73 9.73 0 0 0 7.924 4.85h.06a1 1 0 0 0 1-1V3.02a1 1 0 0 0-1.06-.998Z"></path>
                            </svg>
                        </button>
                        <button class="kg-video-mute-icon kg-video-hide" aria-label="Mute">
                            <svg xmlns="http://www.w3.org/2000/svg" viewBox="0 0 24 24">
                                <path d="M16.177 4.3a.248.248 0 0 0 .073-.176v-1.1a1 1 0 0 0-1.061-1 9.728 9.728 0 0 0-7.924 4.85.249.249 0 0 1-.221.133H5.25a3 3 0 0 0-3 3v2a3 3 0 0 0 3 3h.114a.251.251 0 0 0 .177-.073ZM23.707 1.706A1 1 0 0 0 22.293.292l-22 22a1 1 0 0 0 0 1.414l.009.009a1 1 0 0 0 1.405-.009l6.63-6.631A.251.251 0 0 1 8.515 17a.245.245 0 0 1 .177.075 10.081 10.081 0 0 0 6.5 2.92 1 1 0 0 0 1.061-1V9.266a.247.247 0 0 1 .073-.176Z"></path>
                            </svg>
                        </button>
                        <input type="range" class="kg-video-volume-slider" max="100" value="100">
                    </div>
                </div>
            </div>
            <figcaption><p><span style="white-space: pre-wrap;">Your real-time Python dashboard, built with Tinybird and Dash</span></p></figcaption>
        </figure><h2 id="next-steps">Next steps</h2><p>Tinybird and Dash form a powerful duo, making it possible to create and deploy real-time Python data apps on the web with relatively little code.</p><p>Bear in mind that this is an elementary example, both in terms of data pipelines and data visualization. There are many ways to further optimize your Tinybird APIs by using proper indexing and creating <a href="https://www.tinybird.co/blog-posts/what-are-materialized-views-and-why-do-they-matter-for-realtime">Materialized Views</a> to calculate important aggregates at ingestion time instead of querying time.</p><p>If you'd like to learn more about Dash, check out their <a href="https://dash.plotly.com">documentation</a>.</p><p>If you'd like to learn more about Tinybird, you can visit the <a href="https://www.tinybird.co">website</a>, check out the <a href="https://www.tinybird.co/docs">docs</a>, or watch our <a href="https://www.youtube.com/playlist?list=PLZGPeFpwVFOQKmRILfQd3oJ7j_MA70XE0">YouTube screencasts</a>. If you're ready to start building with Tinybird, go ahead and <a href="https://www.tinybird.co/signup">sign up for a free account</a> if you haven't already. If you have questions or get stuck while building, then <a href="https://www.tinybird.co/docs/community" rel="noreferrer">join our Slack community</a>.</p><p>If you're interested in understanding more about Tinybird and the features and pricing of Pro or Enterprise accounts, please <a href="https://www.tinybird.co/request-a-demo">request a demo</a>. We'd be happy to talk through your use case and show you how Tinybird can help you unify your data sources, build real-time data products with nothing but SQL, and empower your organization to build with data.</p><h2 id="frequently-asked-questions">Frequently asked questions</h2><p>Here are answers to some questions commonly asked about this tutorial and building real-time dashboards with Tinybird.</p><h3 id="why-tinybird-instead-of-a-library">Why Tinybird instead of a library?</h3><p>You might be wondering, "Why use Tinybird instead of a library like <code>polars</code> to process data?". While <code>polars</code> represents a big advancement for in-process data analysis using Python, Tinybird has some benefits that certain users might appreciate, namely:</p><ol><li><strong>Simple API abstractions for data ingestion from a variety of sources</strong>, including streaming data platforms like Apache Kafka or Confluent, data warehouses like BigQuery and Snowflake, object storage systems like Amazon S3, or even CSV files. Regardless of the source, capturing <a href="https://webflow.tinybird.co/blog-posts/definition-of-real-time-data" rel="noreferrer">real-time data</a> in Tinybird is very simple.</li><li><strong>Full OLAP database</strong>. Tinybird supports complex queries at scale thanks thanks to its underpinning <a href="https://www.tinybird.co/blog-posts/real-time-databases-what-developers-need-to-know" rel="noreferrer">real-time database</a> (ClickHouse®) and serverless model. Because of this, Tinybird can potentially handle larger volumes of data much more quickly, as it won't be constrained by the RAM available on a single machine. Note that <code>polars</code> does offer <a href="https://github.com/pola-rs/polars/releases/tag/py-0.14.19" rel="noreferrer">mechanisms for processing data larger than your RAM</a>, though this comes with some performance implications.</li><li><strong>API flexibility. </strong>Tinybird allows you to publish real-time data pipelines as REST APIs. These can be visualized with Python libraries, but they can support many other use cases such as <a href="https://www.tinybird.co/blog-posts/real-time-personalization" rel="noreferrer">real-time website personalization</a>, <a href="https://www.tinybird.co/blog-posts/real-time-dashboard-step-by-step" rel="noreferrer">real-time Javascript-based web dashboards,</a> operational intelligence dashboards, etc. The ability to access query results in real-time as a REST API gives Tinybird some flexibility over alternatives.</li><li><strong>It's free for simple projects. </strong>Tinybird isn't an open source library, but it is <a href="https://www.tinybird.co/signup" rel="noreferrer">free to sign up</a> with no time restriction and generous free tier limits.</li></ol><p>Certainly, tools like <code>pandas</code>, <code>polars</code>, or even DuckDB can be used for processing and visualizing data with Python, but in this tutorial, we use Tinybird thanks to its simplicity, scalability, and flexibility.</p><h3 id="why-dash-instead-of-matplotlib-seaborn-bokeh-highcharts-or-streamlit">Why Dash instead of matplotlib, seaborn, Bokeh, Highcharts, or Streamlit?</h3><p>Certainly any of these Python visualization libraries would work well for Python data visualization, but we like Dash for a few reasons:</p><ol><li><strong>Easy to set up a simple web dashboard</strong>. Dash is probably the simplest tool for setting up and styling a web dashboard with Python. As Dash is based on <a href="https://github.com/pallets/flask" rel="noreferrer">Flask</a>, a popular Python web framework, it includes functionality that makes deploying our dashboard to the web that much easier.</li><li><strong>It leverages the <code>pandas</code> library</strong>. It's very easy to structure data for visualization with Dash, as you can use <code>pandas</code> DataFrames to structure data for visualization. In our tutorial, we capture JSON data from Tinybird APIs and normalize it into a <code>pandas</code> DataFrame to be visualized with Dash. This all happens in just a few lines of code.</li><li><strong>It's free!</strong> Dash Core is a free, open source library provided by <a href="https://plotly.com" rel="noreferrer">Plotly</a>. If you want to scale up without and access new features, you can upgrade to <a href="https://plotly.com/dash/" rel="noreferrer">Dash Enterprise</a>.</li></ol><p>Of course, you <em>can</em> use just about any Python data visualization library with Tinybird! Choose what works best for you.</p><h3 id="does-tinybird-cache-query-responses">Does Tinybird cache query responses?</h3><p>No, and for a good reason. While using a cache can certainly improve frontend performance, and is often useful in many cases, Tinybird is a <a href="https://www.tinybird.co/blog-posts/real-time-data-platforms" rel="noreferrer">real-time platform</a> designed to create low-latency analytics APIs over the freshest possible data. Most Tinybird customers capture thousands to millions of new events per second, and they want to visualize the results of their Pipes with all of that new data as quickly as possible.</p><h3 id="how-fast-do-tinybird-apis-respond">How fast do Tinybird APIs respond?</h3><p>If you go to an API page in the Tinybird UI, you can see stats for average query latency. Of course, the latency of your queries depends on how much data those APIs process, but generally speaking most Tinybird APIs can be optimized to respond in 50ms or less.</p><h3 id="how-much-does-tinybird-cost">How much does Tinybird cost?</h3><p>Tinybird is free for small projects, with no credit card required and no time limit. Once you exceed the free limits of 10 GB of storage or 1,000 API requests per day, you can upgrade to Pro or Enterprise plans. To learn more about features and pricing for these plans, check out the Tinybird <a href="https://www.tinybird.co/pricing">Pricing page</a>.</p>