


If you're running distributed systems, you're probably already collecting metrics, logs, and traces with OpenTelemetry.
Today, we're releasing the Tinybird OpenTelemetry Exporter: a simple and standard way to stream logs, traces, and metrics directly into Tinybird data sources.
Why OpenTelemetry?
OpenTelemetry (OTel) has become the industry standard for collecting observability signals from distributed systems. It's open, vendor-neutral, and integrates with just about everything.
Now, Tinybird is a first-class backend for OTel data. With the Tinybird OpenTelemetry exporter, you can send metrics, logs, and traces straight from an OpenTelemetry Collector into Tinybird without any glue code or extra hops.
If you're an existing Tinybird user and already leverage OpenTelemetry collectors for observability, you now have a much simpler way to export that data into Tinybird.
Or, if you are migrating from another OTel-compatible backend (like ClickHouse®), you can switch with minimal changes, as the Tinybird exporter supports the ClickHouse® exporter format.
How the Tinybird OTel Exporter works
The Tinybird OpenTelemetry Exporter is a plugin for the OpenTelemetry Collector. It lets you stream telemetry data in real-time from your applications and services into Tinybird simply by configuring an exporter with a Tinybird API host, token, and data source names for logs, traces, and metrics signals.
The Tinybird OpenTelemetry Exporter is now officially available in the OpenTelemetry Collector Contrib repository as of release v0.131.0 and is marked as alpha status. You can now use the official OpenTelemetry Collector distributions that include the Tinybird exporter out of the box.
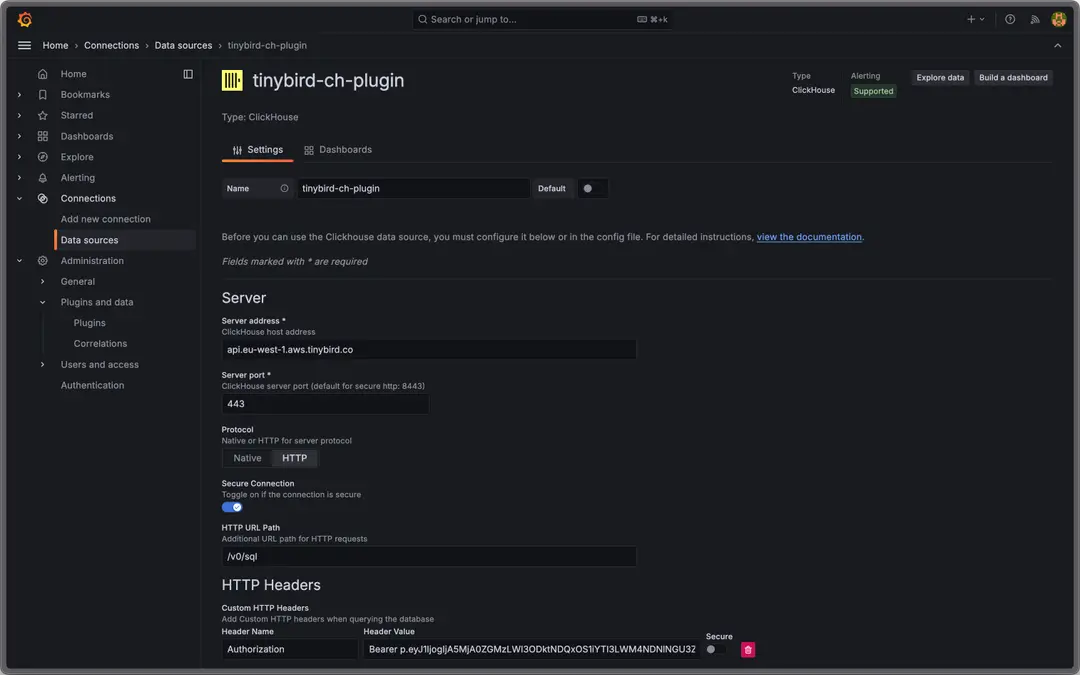
ClickHouse® compatibility
In addition, the Tinybird schemas for otel_logs are compatible out-of-the-box with the ClickHouse® exporter and the ClickHouse® plugin for Grafana, so you can quickly connect Grafana to your Tinybird workspace using a certified plugin.
We're working on adding ClickHouse® compatibility for traces and metrics as well.
How to get started
We've created a Tinybird OpenTelemetry template including ClickHouse®-compatible data source schemas, as well as some example API endpoints to process and visualize your OTel data.
Getting started is simple:
Deploy the Tinybird OpenTelemetry template:
tb --cloud deploy --template "https://github.com/tinybirdco/tinybird-otel-template/tree/main/"Instrument your app with OTel SDKs.
Deploy the OpenTelemetry Collector with the Tinybird exporter. The Tinybird exporter is available in the official OpenTelemetry Collector Contrib distribution (v0.131.0 or later), or you can download precompiled binaries from the official releases.
Configure the Tinybird exporter, providing the host, token, and data source names from your deployed Tinybird workspace, for example:
exporters:
  tinybird:
    endpoint: ${OTEL_TINYBIRD_API_HOST}
    token: ${OTEL_TINYBIRD_TOKEN}
    wait: true
    metrics:
      gauge:
        datasource: "metrics_gauge"
      sum:
        datasource: "metrics_sum"
      histogram:
        datasource: "metrics_histogram"
      exponential_histogram:
        datasource: "metrics_exponential_histogram"
    traces:
      datasource: "traces"
    logs:
      datasource: "logs"
    retry_on_failure:
      enabled: true
    sending_queue:
      enabled: true
      queue_size: 104857600     # 100 MB total buffer size
      sizer: bytes
      batch:
        flush_timeout: 5s
        min_size: 1024000     # 1 MB min batch size
        max_size: 10000000    # ~10 MB max batch size
You'll start capturing telemetry data into the Tinybird. You can then:
- Connect your Tinybird workspace to Grafana for standardized observability
- Build materialized views and endpoints to process and expose logs analytics
- Connect AI apps and agents to your telemetry data and APIs using the Tinybird MCP Server.
What else can you build?
The beauty of capturing OTel data into Tinybird is not just that it offers a standardized observability stack for Tinybird users, but that you can also use Tinybird to build real-time analytics APIs to process and expose logs analytics to users, apps, and agents.
Some examples:
- Performance benchmarks for LLMs: Stream and analyze model latencies in real time.
- Website and API analytics: Track usage, errors, and performance with custom dashboards.
- Build your own APM: Trace latency, throughput, and error rates across services—just like Datadog, but built on Tinybird and tailored to your stack.
- Operational monitoring: Expose custom metrics to your ops team with REST APIs and visualizations, or via a Slack agent connected to the Tinybird MCP Server.
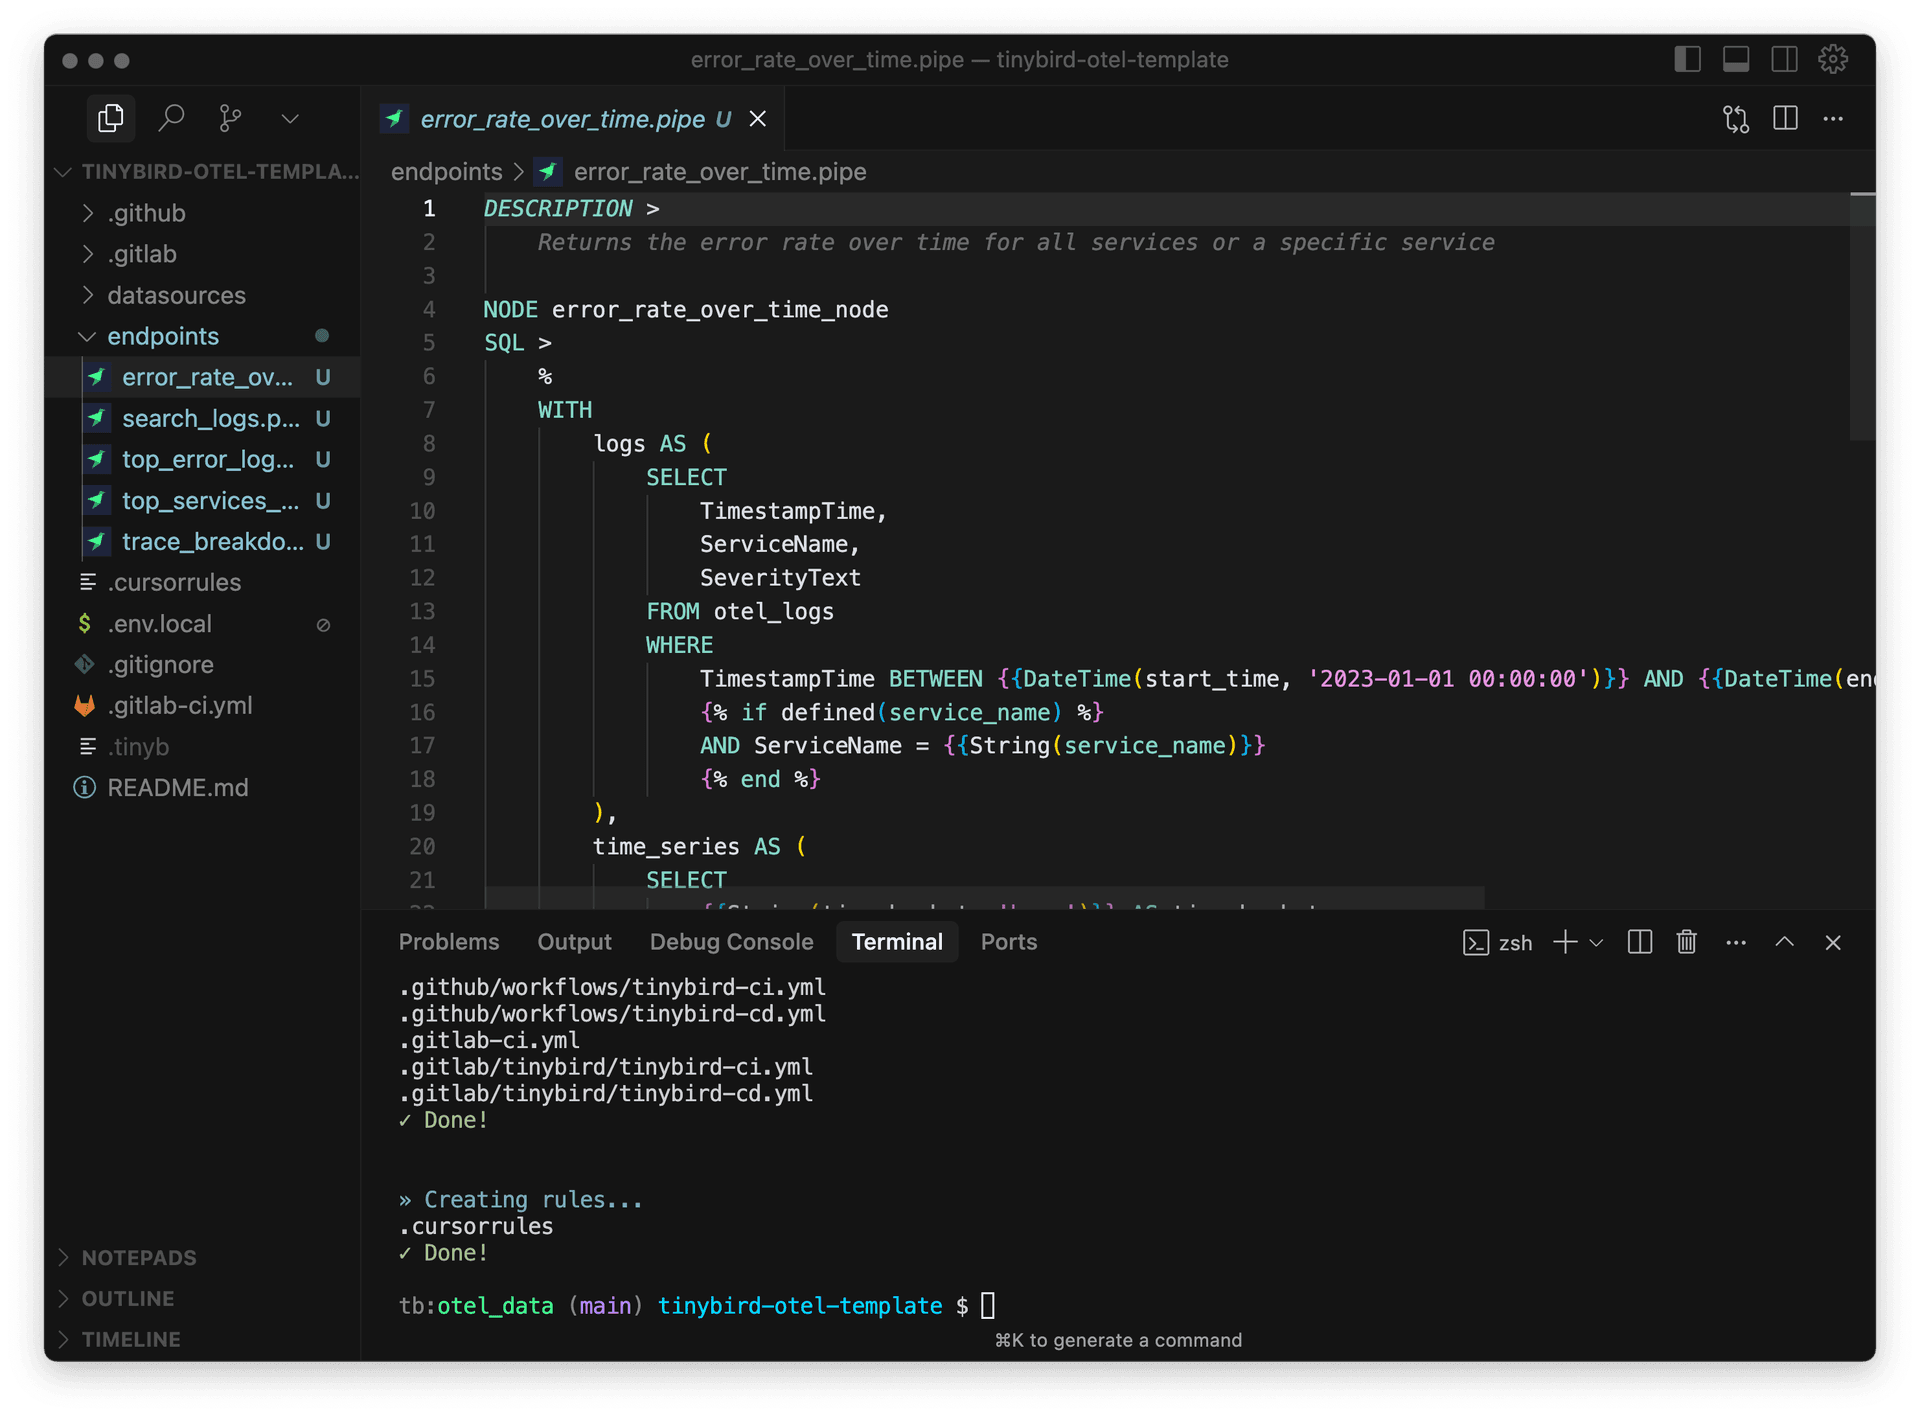
You can also create your own API endpoints on top of the Tinybird OpenTelemetry template:
# Clone the template repo
git clone https://github.com/tinybirdco/tinybird-otel-template.git
cd tinybird-otel-template

# Login to Tinybird and start the local server
tb login
tb local start
tb create --prompt "Create endpoints for a web application dashboard that will \
  show top error logs by service and error rate over time, and top 5 services by \
  request count and trace breadkdown by trace_id. In addition, create an endpoint \
  to enable search over logs."
You'll get something like this:
Of course, modify the tb create prompt for your use case. Then, just use tb --cloud deploy to publish the produced pipe files as hosted API endpoints:
curl -X GET "https://api.us-east.aws.tinybird.co/v0/pipes/error_rate_over_time.json?start_time=2023-01-01+00%3A00%3A00&end_time=2023-12-31+23%3A59%3A59&time_bucket=hour&token=p.ey..."
Try it today
The Tinybird Exporter is officially available in the OpenTelemetry Collector Contrib repository as of the v0.131.0 release.
- Read the documentation
- Deploy the Tinybird OTel template
- Install the official OpenTelemetry Collector (v0.131.0 or later) and configure the Tinybird exporter.
- Connect Tinybird to Grafana
- Create your own real-time analytics APIs over OTel data
What's next
The Tinybird Exporter provides a simple and standardized way to stream OTel data into a Tinybird workspace. With the Tinybird exporter now officially available in the OpenTelemetry Collector Contrib repository, it's easier than ever to get started with standardized observability on Tinybird. We'll continue to share more resources on how to leverage OTel data within Tinybird to build apps, agents, and visualizations.
Questions and feedback?
We'd love to hear how you're using OpenTelemetry and what you want to see next. Reach out in our Slack community with questions and feedback.