


Last year, we made the difficult decision to stop deploying any changes to production for one week.
In the grand scheme of things, one week isn’t that long. But to us, it felt like forever. We are constantly iterating and release multiple changes every day. It’s one of the upsides of running a purely managed service; we manage the update lifecycle of our product, and it's totally transparent to our users. Not pushing any fixes or improvements for a whole week felt... unnatural.
So, why did we do it? In short, our CI had become unreliable. Slow, non-deterministic, flaky, moody. If that sounds like a lazy teenager, that’s about how it felt. Our CI pipeline wasn’t carrying its weight, and we were losing trust in it.
The Tinybird team has grown a lot (and still is - come join us!). The team is writing more code, and as the codebase has grown, so too has the test suite. Tinybird’s increasing popularity just accelerates this growth further. And while it feels incredible to see something you’ve built take on such a life of its own, sadly, it comes with the technical debt to which no project - including ours - is immune.
We reached a point where it was taking hours to deploy a change to production. The CI runs didn’t actually take that long, but we started to see an increase in tests failing. We would spend hours hunting down the root cause, only to realize that the failure was not related to a code change, but a random failure caused by the CI environment. This wasted huge amounts of our time (and sanity!)
We reached a point where it was taking hours to deploy a change to production due to slow runs and flaky tests.
If we wanted to iterate fast, we couldn’t go on like this.
"Fix CI, then go ship"
So, for one week, we had a new mantra: "fix CI, then go ship"
Surely the solution was pretty obvious, right?
“Use a CI service that allows you to run multiple jobs in parallel on multiple machines with multiple containers with multiple processes/threads/workers.“
Which basically means…

So we did:
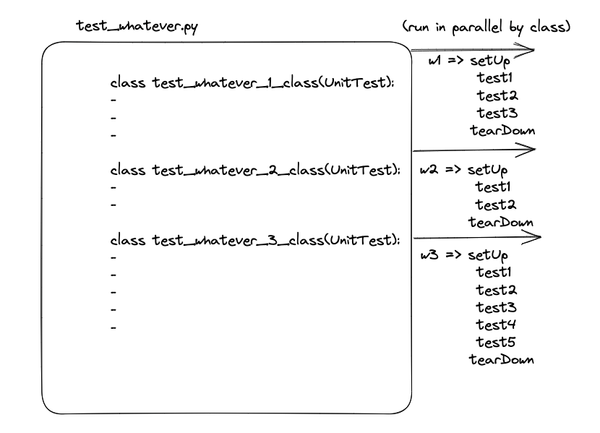
- Tests: Group tests in classes that can be parallelized using pytest-xdist or pytest-parallel
- Jobs: Use a CI service that allows us to run multiple jobs in parallel. We have a job depending on the type of change: ui, backend, docs, etc.; the type of tests: integration, unit, e2e, etc.; and the type of environment: we test different versions of Python, ClickHouse®, etc.
- Pipelines: Use an "auto-scalable" job runner
Our CI process was pretty standard: Every commit in an MR triggered a GitLab Pipeline, which consisted of several jobs. Those jobs would run in an auto-scaling Kubernetes cluster with up to 21 nodes, where an orchestrator would run new nodes depending on the required resources per job.
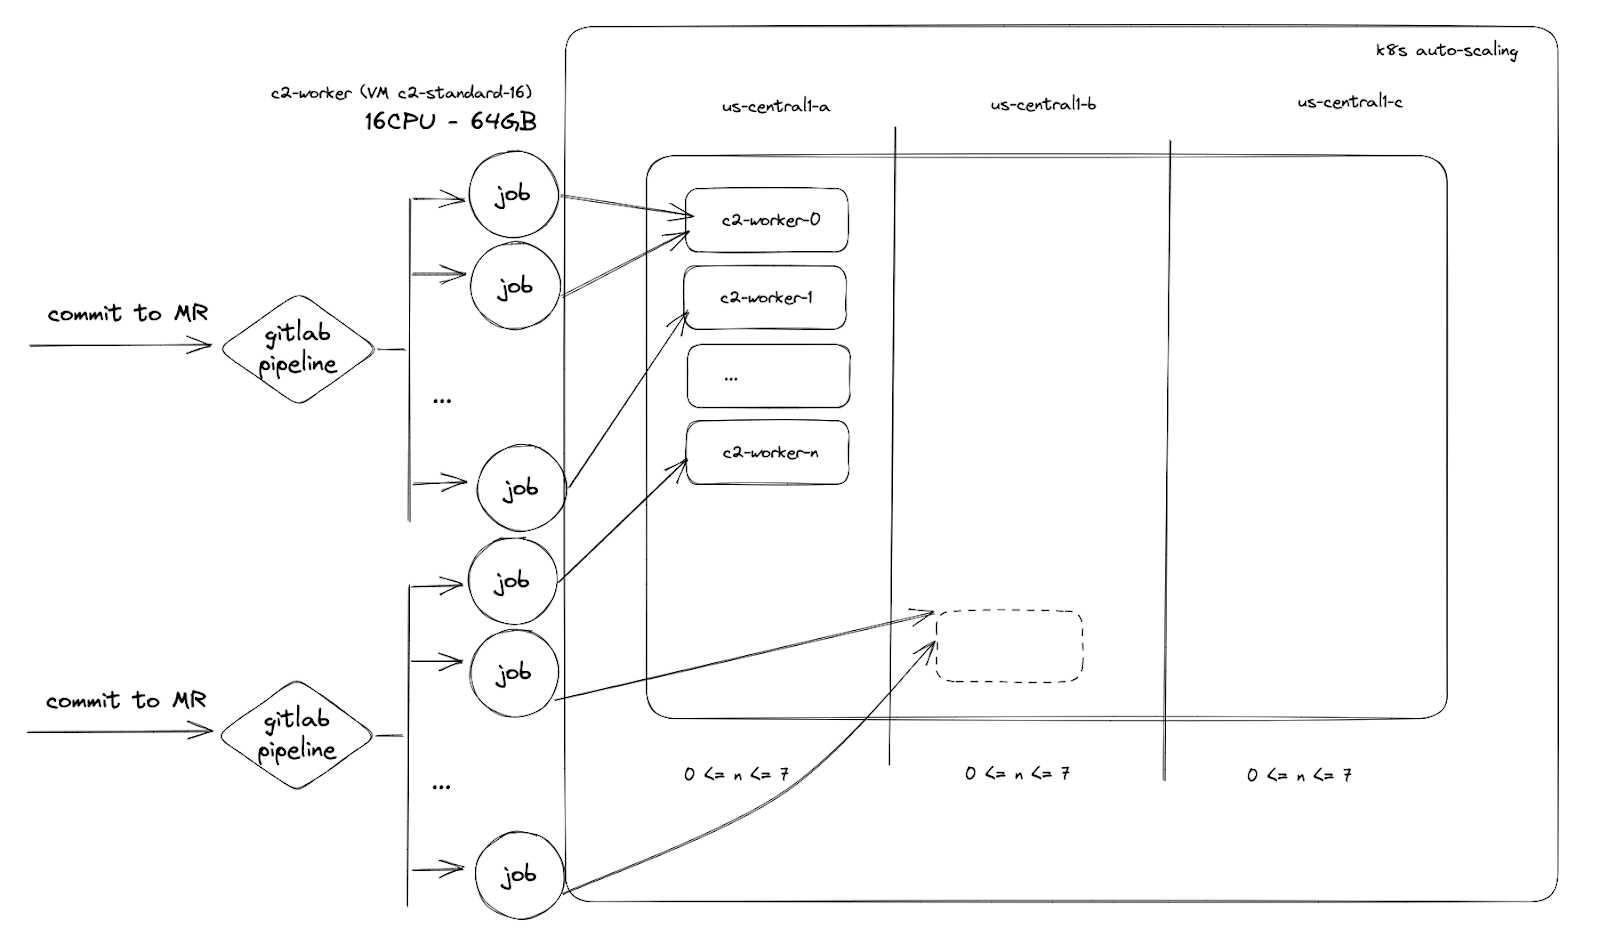
Our CI process was pretty standard. GitLab pipelines with several jobs running on an auto-scaling k8s cluster and an orchestrator assigning resources.
We got to a point where CI cycles took 7 minutes on average and flaky tests were almost gone.
Job done.
/endblog
“If left alone a CI pipeline can only degrade over time.”
Not so fast.
After a few months, we were almost back to square one.
The team, codebase, and test suite continued to grow. The product was taking off like a rocket ship. We were processing way more data, serving more complex use cases, and continuing to ship amazing features.
It was clear that our previous attempt to fix CI had failed to address the underlying issue.
Execution time of successful CI run trended up past 12 minutes, and job success, once again, became non-deterministic. About 4 out of 10 runs would fail, and then succeed after simply re-running the job.
Our attempts to fix our CI pipeline had failed. Tests were slow again, and 4 out of 10 runs would fail.
Including failures, retries and debugging, the average execution time was over an hour.

We needed a better way to understand what was actually happening in our CI and work out the root cause of the problem.
But here’s the catch.
Our CI was generating billions of lines of logs. There was absolutely no way we could manually trawl through it all.
We needed data.
Our three rules
- The first thing you need if you want to improve something, no matter what, is data. Without data you are totally blind.
- The second thing you need is observability over that data. You can have data, but if you are not analyzing it correctly, you are still totally blind (or worse, misled).
- Lastly, your data needs to be fast. If your data takes 5 minutes to be queryable, or queries take minutes to execute, you’re just wasting even more developer time.
Using Tinybird to cut our CI pipeline in half
Fortunately, the product we are building at Tinybird is a scalable, real-time analytics platform, which meant we had the right tool for the job: our own product!

Step 1: Send CI telemetry data to Tinybird
First, we needed to start collecting all of the data. As I mentioned above, our CI jobs produce massive amounts of it. We wanted to be able to keep up with the volume, but we weren’t interested in creating and managing more infrastructure (we’re building a serverless product after all) or complicating our CI environment even further with additional software like logging agents or libraries.
So, we utilized the Tinybird Events API, which is a standard HTTP endpoint that ingests JSON data from POST requests at high frequency. Since we’re using Python, we already had the ability to create JSON payloads and send POST requests without introducing any new dependencies.
We used the Tinybird Events API - a standard HTTP endpoint - to send high-frequency CI telemetry logs to Tinybird.
Sending data from pytest to Tinybird was simple. Pytest provides some hooks, one of them being pytest_terminal_summary. We just created an override for that hook like this code snippet. Easy and effective. It keeps the pipeline lean and does not add any noticeable latency.
Step 2: Write some SQL to analyze the data
With all of our CI telemetry data landing in Tinybird, we began to experiment with different kinds of analysis and visualization. We built our visualizations in Grafana, since we were already use it and it integrates nicely with Tinybird APIs.
Our team analyzed the data in Tinybird by building SQL Pipes, and we discovered that our initial assumptions about “what to look for” and “how to show it” weren’t particularly accurate. We prototyped different queries and explored different ways of visualizing the results in Grafana with different charts; lines became pies, bars became tables.
The beauty of this solution is that we could collaborate and iterate fast. The SQL lived in Tinybird, so anyone could reuse the same logic to build different charts without needing to create duplicates. The data was fresh (less than 1 second total latency from CI execution to available for query) and queries were instantaneous (<100 ms).
We used Tinybird Pipes - chained, composable SQL statements - to prototype queries and build metrics.
We developed dashboards as fast as the ideas came; there was no idle time waiting for things to load.
Eventually, we reached a consensus, and settled on the first version of the dashboard. We tidied everything up, got rid of the noise, and put all our Tinybird SQL into Git. Tinybird lets you instantly publish the results of your SQL Pipes as HTTP APIs so we could easily integrate the endpoints we published with Grafana.
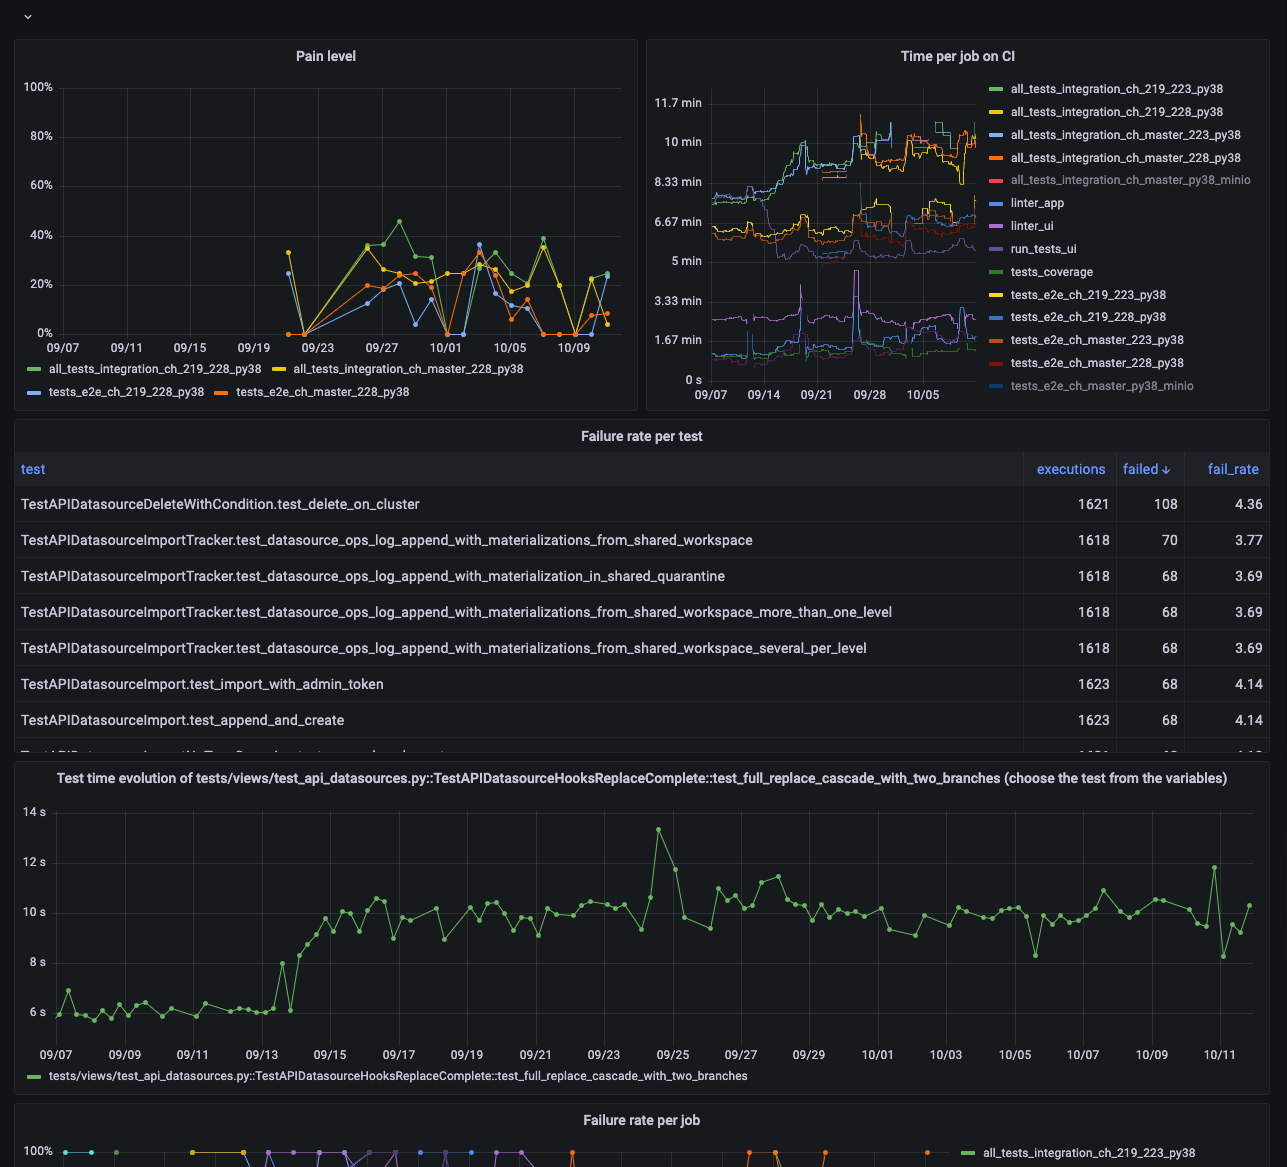
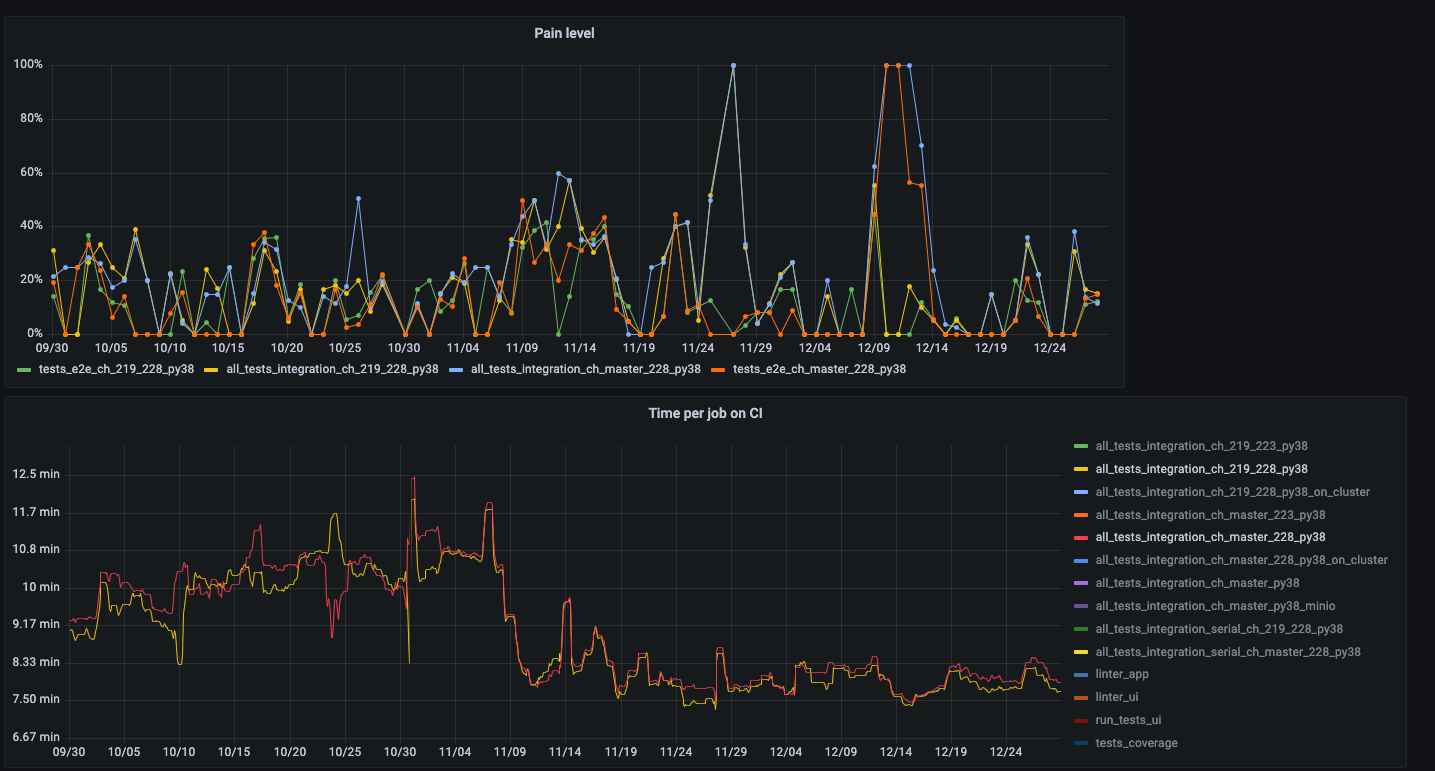
Our Grafana dashboard has four main panels:
- Pain level (rate of failure for a CI run)
- Time per job
- Failure rate per test
- Test time evolution (test execution duration over time)
As our CI grows, so does the amount of data. We’ve heavily optimized our queries, taking advantage of Materialized Views (which update automatically in Tinybird as rows are ingested) to significantly reduce the amount of data processed at query time (dashboard refresh). We benefit from both high data freshness and low dashboard latency for a great analytics experience.
Tinybird lets you instantly publish Pipes as HTTP endpoints, so we used those to power our Grafana dashboard.
We retain all of the raw data so that we can continue to experiment with new analyses and compare patterns over historical CI runs.
With this new dashboard, we learned that we had three core problems.
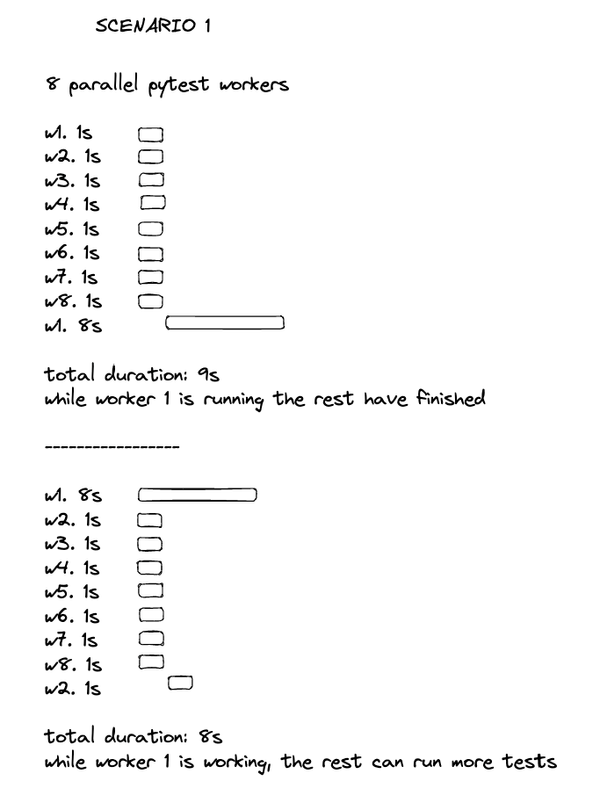
Problem 1: Inefficient utilization of test workers
Even though our tests could run in parallel thanks to pytest-xdist, we still had idle workers. The fastest tests were being assigned first, with slow tests coming last. All of the workers blitzed through the fast tests in parallel, and then we had to wait while one worker chugged through a massive test on its own.
The fix is simple: order the tests with the slowest test executing first.
It turns out that pytest runs tests alphabetically by default. You’d think that would give you a reasonable shot at a random distribution, but I guess we’re unconsciously biased towards As and Bs and against Ys and Zs. 🤷
Pytest runs tests alphabetically by default, and this was interestingly causing our slowest tests to run last.
Fortunately, since we were capturing all of the data about execution times into Tinybird, we could easily produce a list of tests ordered with the slowest first, averaging over the last 24 hours.
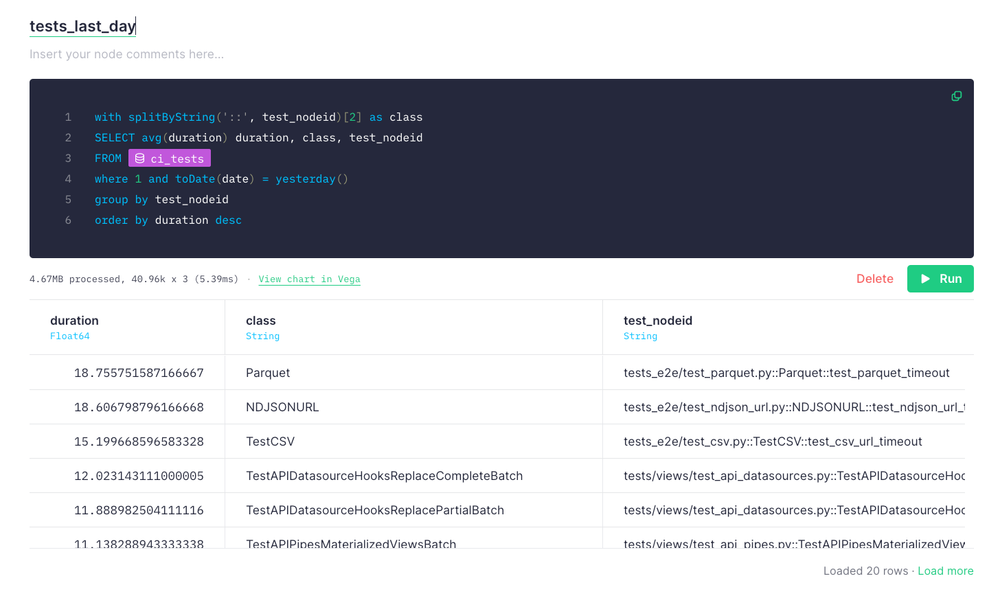
Again, we capitalized on the ability to publish this SQL as APIs in Tinybird, and with that we now had a super fast API to return a simple ordered array of tests.
In pytest, we overrode the pytest_collection_modifyitems hook to dynamically control the order of test execution during pytest initialization. We now call our new HTTP API in the hook and build the execution order according to the result. You can see what that override looks like in this code snippet.
This change shaved about 1 minute off the total execution time, or just over 8%. Not bad.
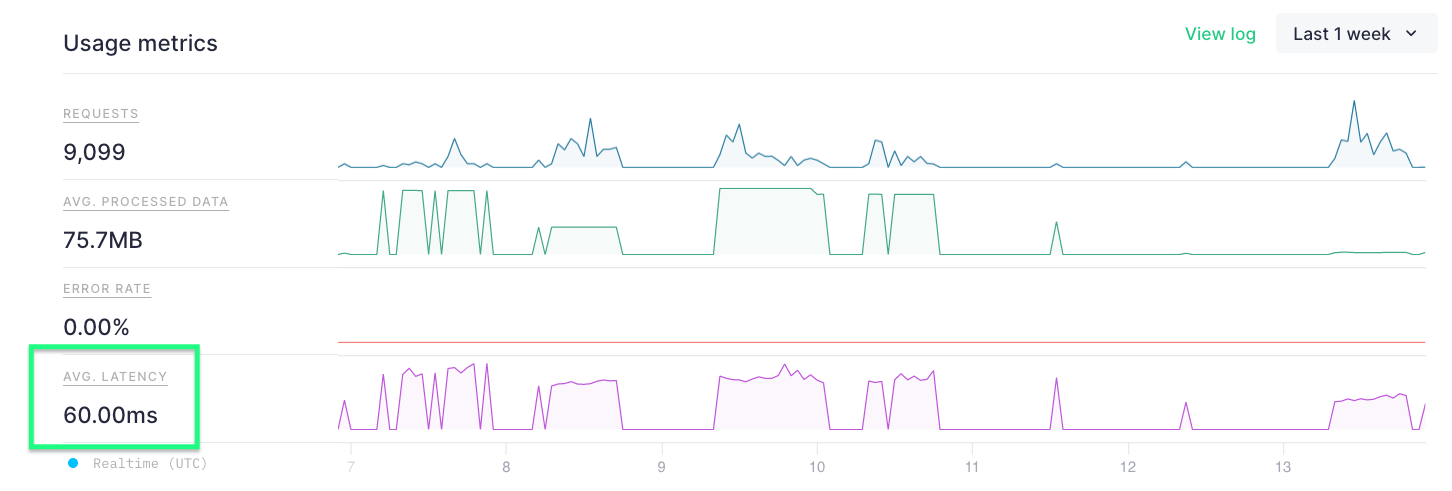
You can see below that the average latency on our HTTP API was just 60ms, so the overhead for this hook is basically nothing.
Problem 2: Inefficient distribution of tests between classes
Some tests took minutes to finish while others took only seconds. Why? Tests weren’t being distributed evenly in the test suite.
So we needed to redistribute the tests across the workers to avoid one bogged down worker from limiting our test speed.
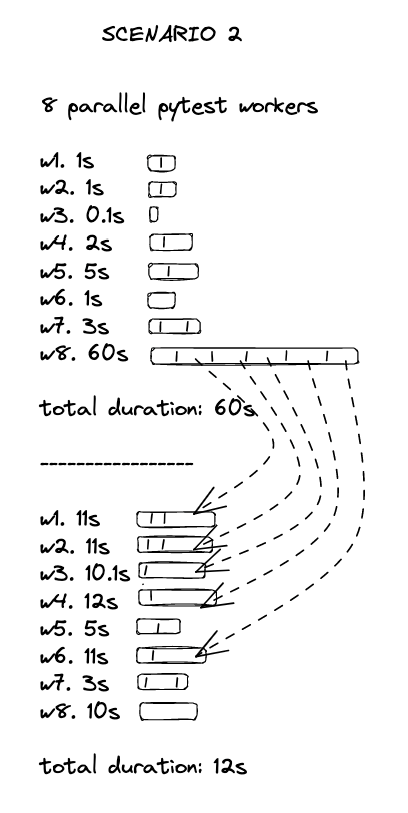
In the same way as the previous improvement, this one was pretty obvious since we had the data. We grouped execution times by their test class, and the imbalance jumped out immediately. Oops.
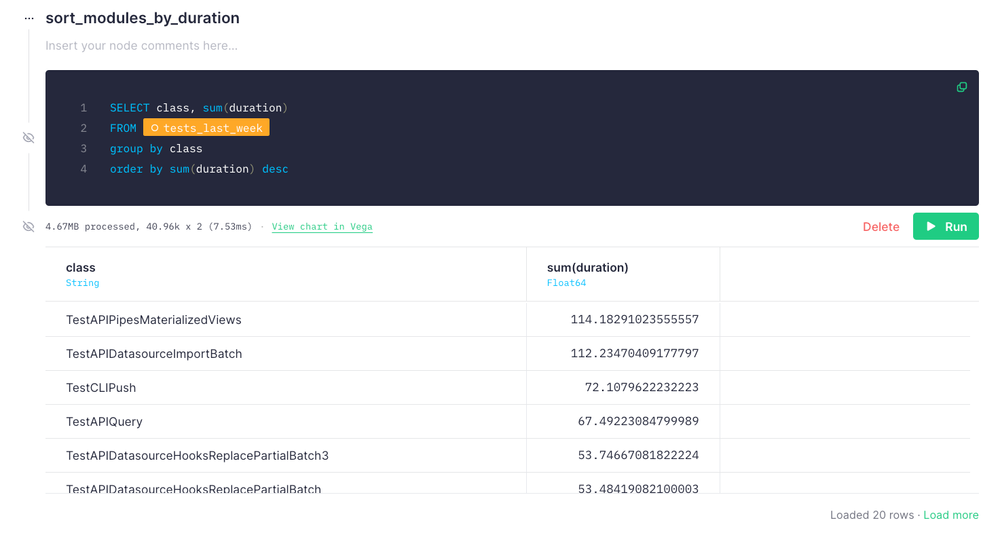
Tests weren't being evenly distributed, so we identified the slow test classes and improved them.
We chose to fix this manually. We probably could have done something fancy to automate it, but doing it manually was faster and the work doesn’t need to be done that often.
From this fix, we got another ~1 minute (8%) of improvement, bringing us to roughly a 15 to 20% reduction in CI time between the first two fixes.
Problem 3: Flaky tests only got worse when we scaled infrastructure
We were happy with the improvements, but not yet satisfied. We wanted to cut our CI time in half. So, why not just double our infrastructure and call it a day?
Well, we tried... It didn’t go well.
Twice the infrastructure did indeed cut the CI execution time in half.
When it succeeded.
Unfortunately, it also drastically increased the number of random failures. Remember that 4 out of 10 failure rate we originally had? It was back! Except for this time, it could sometimes reach 6 out of 10. Talk about pain.
We spent a lot of time looking at tests, trying to figure out what was causing the failures. Why would the failure rate get worse with more infrastructure?
Having not found much success here, we decided to take a step back. Instead of looking at individual tests, we zoomed out to the bigger picture and looked at our CI infrastructure.
Fortunately, we were already monitoring all of the CI infrastructure, charting CPU, memory, and network utilization. Standard stuff.
But, we struck gold when we began to compare the infrastructure monitoring charts with the CI execution charts. We noticed a strong correlation between crazy utilization spikes and CI failure rates.
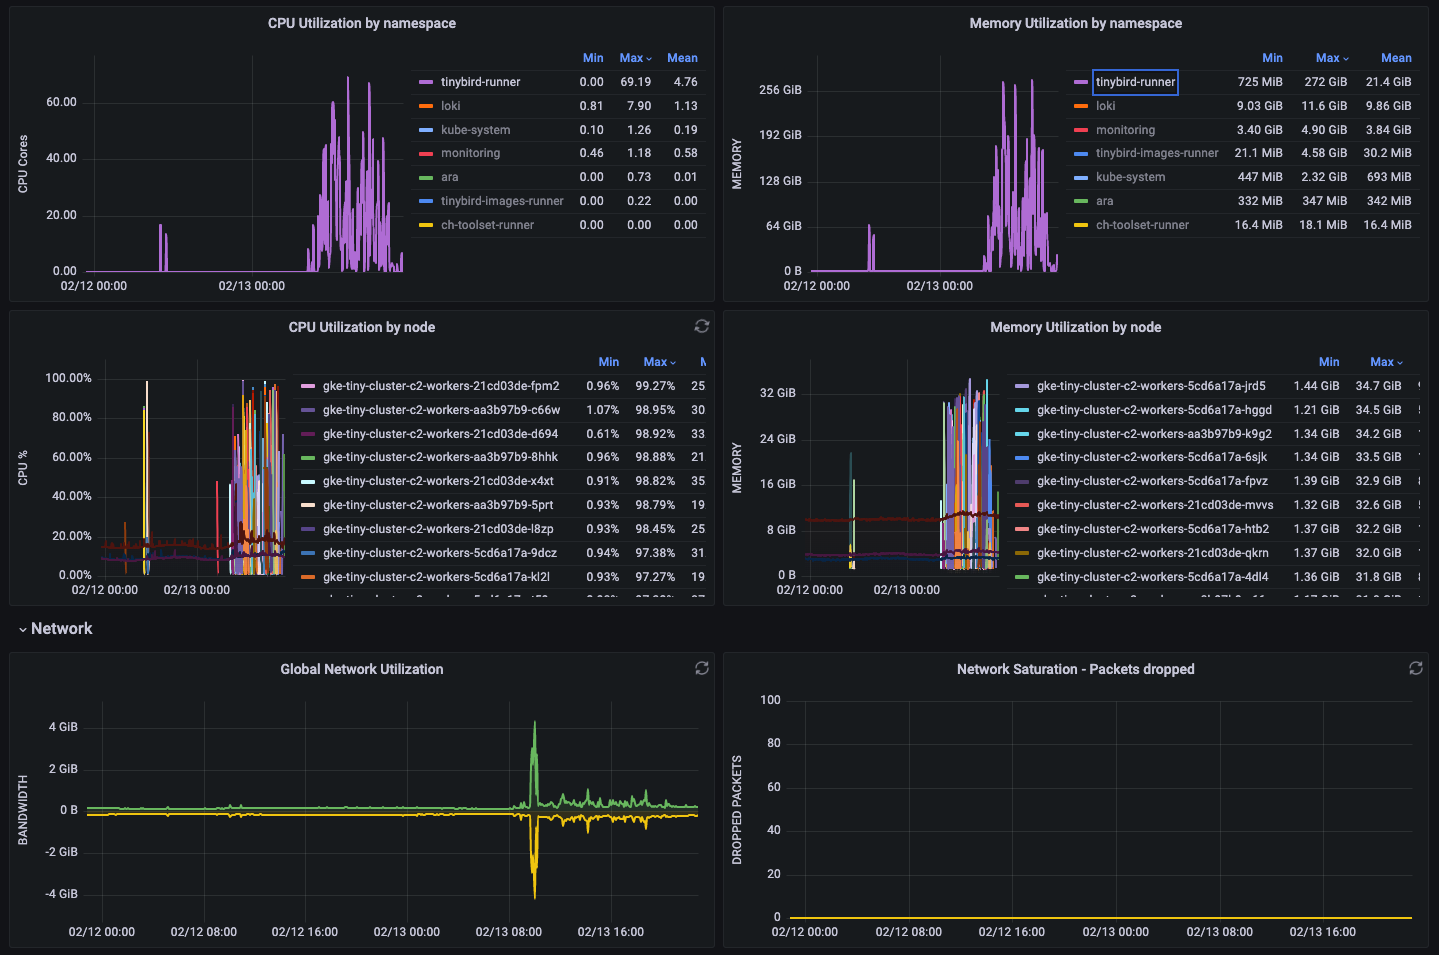
The trouble was that the underlying orchestrator was abstracting so much of the resource allocation that we didn’t have much insight into how it was being allocated, or that it was making odd choices about job placement. I suppose we put a bit too much trust in our robot overlords.
We noticed that as we scaled up k8s, our test failure rates increased significantly. We decided to give each job it's own node so it would have the resources it needs.
We couldn’t simply add more resources. We had to understand more about what each job required. We also couldn’t just rely on the orchestrator to figure everything out for us. This needed a human touch.
After some work, we settled on a setup that gives each job type its own node, guaranteeing that it gets the exact resources the job needs.
Maybe we’ll revisit this in the future when AI has solved all known orchestration problems, but for now, our fix has completely solved the random failures. There’s no more resource contention, and CI runs are deterministic.
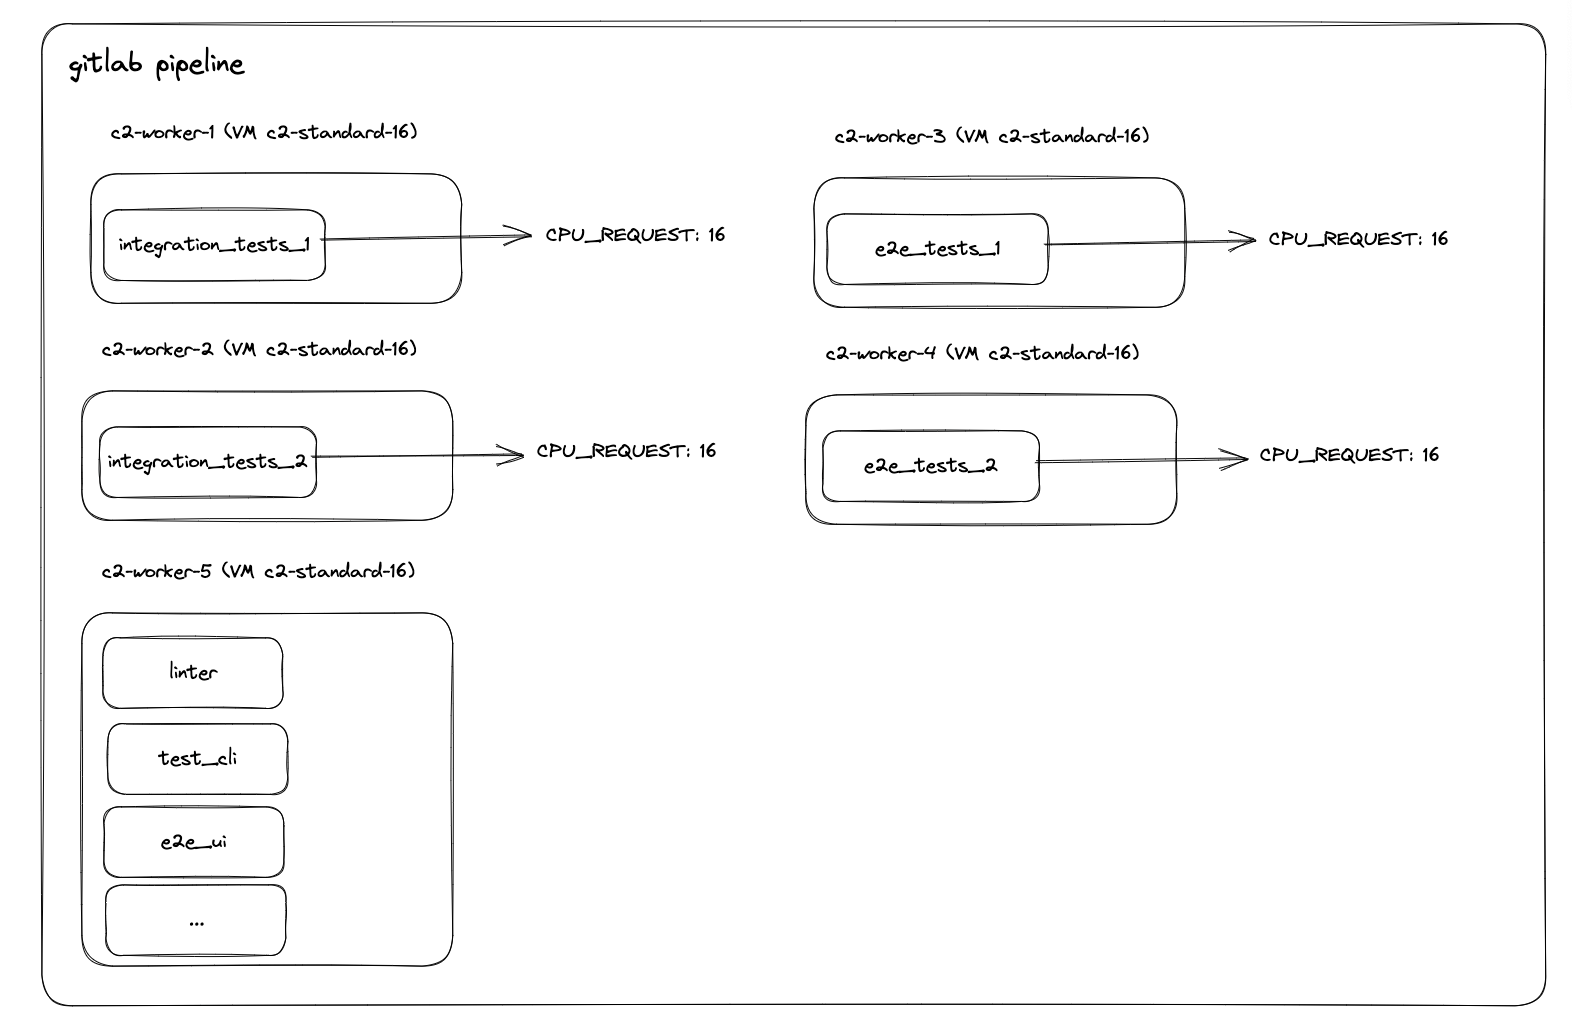
The result? We doubled our infrastructure (without issue), and cut our CI execution time in half.
In reality, it was a 60% reduction but that didn’t sound as catchy.
With these 3 changes, we cut our CI pipeline execution time by 60% and eliminated random job failures.
Lessons learned
- Data is your best friend
- Observability over your data is like going on an amazing road trip with said friend
- Fast data is like doing that road trip in a Lamborghini with marshmallows for seats
- Don't assume throwing infra at the problem is going to have the desired outcome. (I couldn’t fit this one into the analogy).
And perhaps the most important one: don't underestimate the power of a good team.
The technology doesn’t care that things are broken, or that you aren’t shipping changes. Putting everything on hold to fix our own mistakes was tough. It sucked. But it was also an opportunity for us to learn, to reflect on how we work, and to assess the things we prioritize as engineers.
And fixing it felt amazing. Like, windows down in the Lambo cruising down Highway 1 amazing. We are now able to deploy changes to production more than 20 times per day. Time to celebrate.

What’s next
The job will never be done, and we are still evaluating other improvements to our CI pipelines:
- More efficient testing: more unit tests, mocks
- Smarter CI: on run tests that are affected by the changes
- Alerting, so we don’t have to proactively monitor Grafana panels
We’re also hoping to release a pytest plugin so any development team using Python can optimize their CI pipelines like we did.
Want to try Tinybird?
Your CI will never be perfect, but it can be better.
You can sign up for a free Tinybird account and start building today, no credit card required. Tinybird's Free plan has no time limit and includes enough resources for small projects (and even some light prod loads!).