
Data Platform
Managed ClickHouse®
Production-ready with Tinybird's DX
Ingest
Plug in your data, ship in minutes
Query
Sub-second SQL APIs for your data
Kafka Connector
Real-time analytics over your Kafka topics
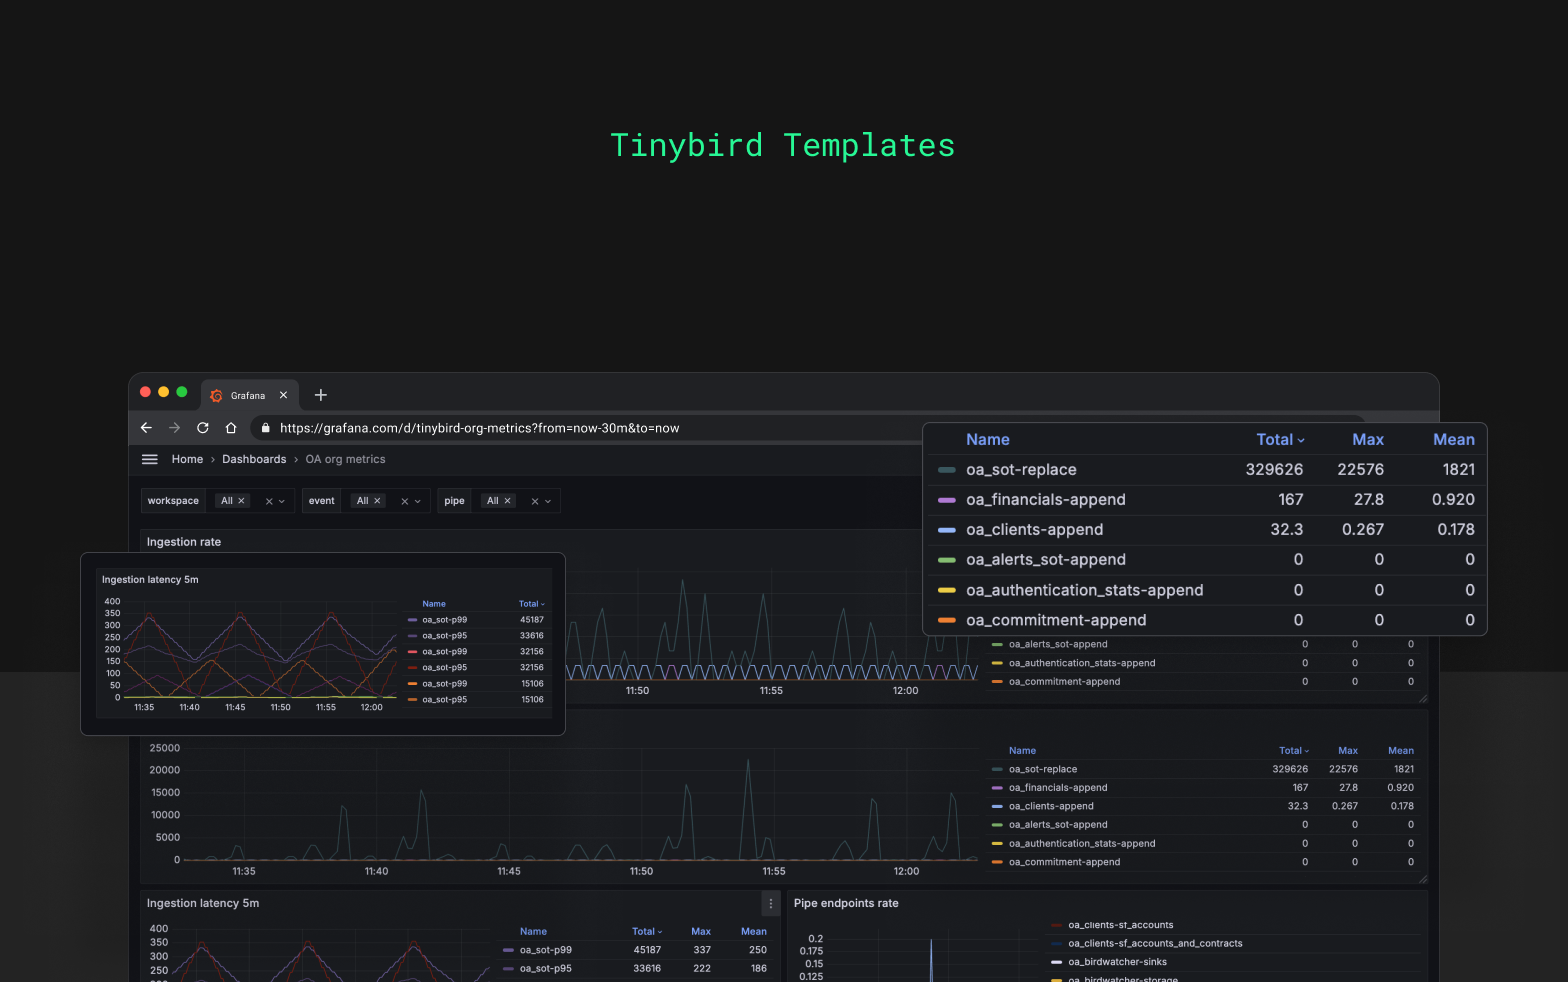
This Org Metrics Exporter template uses Tinybird's Service Data Sources to aggregate and publish organizational metrics as endpoints in Prometheus format for quick integration with common monitoring tools.
Set up the project
# select or create a new workspace
tb login

# deploy the template
tb --cloud deploy --template https://github.com/tinybirdco/tinybird-org-metrics-exporter/tree/main/tinybird
Grafana and Prometheus
To scrape the Tinybird metrics endpoint, you can configure your prometheus.yml file as follows:
scrape_configs:
  - job_name: tinybird_org_metrics
    scrape_interval: 15s  # Adjust the scrape interval as needed
    scheme: 'https'
    static_configs:
      - targets:
        - 'api.tinybird.co'  # Adjust this for your region if necessary
    metrics_path: '/v0/pipes/organization_metrics.prometheus'
    bearer_token: '<your-token>'
- Replace
api.tinybird.cowith your Tinybird host if the workspace is in a different region. See Regions and endpoints. - Token: for a quick check in development, you can use the pre-existing admin
user@domainToken of an Organization admin to authenticate requests (find it in the Tinybird dashboard). But for production, create a dedicated token with minimal permissions using the Tinybird CLI:
tb --cloud token create static prometheus_org_access --scope "WORKSPACE:READ_ALL" --scope "ORG_DATASOURCES:READ"
We've included a sample dashboard config for Grafana to help you get started, see the JSON file.
Datadog and OpenMetrics
Add the following configuration to your OpenMetrics Datadog agent conf.yaml file:
instances:
  - openmetrics_endpoint: 'https://api.tinybird.co/v0/pipes/organization_metrics.prometheus'
    namespace: tinybird_org_metrics
    headers:
      Authorization: 'Bearer <your-token>'
    metrics:
      - "*"
    max_returned_metrics: 700000
- Replace
api.tinybird.cowith your Tinybird host if the workspace is in a different region. See Regions and endpoints.
We've included a sample dashboard config for Datadog that you can use to get started, see the JSON file.
Want to see an example?
Check out these real use-cases built with Tinybird.
START NOW
Skip the infra work. Deploy your first ClickHouse project now

