PricingDocs
Bars

Data Platform

Managed ClickHouse
Production-ready with Tinybird's DX
Streaming ingestion
High-throughput streaming ingest
Schema iteration
Safe migrations with zero downtime
Connectors
Plug and play Kafka, S3, and GCS

Developer Experience

Instant SQL APIs
Turn SQL into an endpoint
BI & Tool Connections
Connect your BI tools and ORMs
Tinybird Code
Ingest and query from your terminal

Enterprise

Tinybird AI
AI resources for LLMs and agents
High availability
Fault-tolerance and auto failovers
Security and compliance
Certified SOC 2 Type II for enterprise
Sign inSign up
Product []

Data Platform

Managed ClickHouse
Production-ready with Tinybird's DX
Streaming ingestion
High-throughput streaming ingest
Schema iteration
Safe migrations with zero downtime
Connectors
Plug and play Kafka, S3, and GCS

Developer Experience

Instant SQL APIs
Turn SQL into an endpoint
BI & Tool Connections
Connect your BI tools and ORMs
Tinybird Code
Ingest and query from your terminal

Enterprise

Tinybird AI
AI resources for LLMs and agents
High availability
Fault-tolerance and auto failovers
Security and compliance
Certified SOC 2 Type II for enterprise
PricingDocs
Resources []

Learn

Blog
Musings on transformations, tables and everything in between
Customer Stories
We help software teams ship features with massive data sets
Videos
Learn how to use Tinybird with our videos
ClickHouse for Developers
Understand ClickHouse with our video series

Build

Templates
Explore our collection of templates
Tinybird Builds
We build stuff live with Tinybird and our partners
Changelog
The latest updates to Tinybird

Community

Slack Community
Join our Slack community to get help and share your ideas
Open Source Program
Get help adding Tinybird to your open source project
Schema > Evolution
Join the most read technical biweekly engineering newsletter

Our Columns:

Skip the infra work. Deploy your first ClickHouse
project now

Get started for freeRead the docs
A geometric decoration with a matrix of rectangles.

Product /

ProductWatch the demoPricingSecurityRequest a demo

Company /

About UsPartnersShopCareers

Features /

Managed ClickHouseStreaming IngestionSchema IterationConnectorsInstant SQL APIsBI & Tool ConnectionsTinybird CodeTinybird AIHigh AvailabilitySecurity & Compliance

Support /

DocsSupportTroubleshootingCommunityChangelog

Resources /

ObservabilityBlogCustomer StoriesTemplatesTinybird BuildsTinybird for StartupsRSS FeedNewsletter

Integrations /

Apache KafkaConfluent CloudRedpandaGoogle BigQuerySnowflakePostgres Table FunctionAmazon DynamoDBAmazon S3

Use Cases /

User-facing dashboardsReal-time Change Data Capture (CDC)Gaming analyticsWeb analyticsReal-time personalizationUser-generated content (UGC) analyticsContent recommendation systemsVector search
All systems operational

Copyright © 2025 Tinybird. All rights reserved

|

Terms & conditionsCookiesTrust CenterCompliance Helpline
Tinybird wordmark
PricingDocs
Bars

Data Platform

Managed ClickHouse
Production-ready with Tinybird's DX
Streaming ingestion
High-throughput streaming ingest
Schema iteration
Safe migrations with zero downtime
Connectors
Plug and play Kafka, S3, and GCS

Developer Experience

Instant SQL APIs
Turn SQL into an endpoint
BI & Tool Connections
Connect your BI tools and ORMs
Tinybird Code
Ingest and query from your terminal

Enterprise

Tinybird AI
AI resources for LLMs and agents
High availability
Fault-tolerance and auto failovers
Security and compliance
Certified SOC 2 Type II for enterprise
Sign inSign up
Product []

Data Platform

Managed ClickHouse
Production-ready with Tinybird's DX
Streaming ingestion
High-throughput streaming ingest
Schema iteration
Safe migrations with zero downtime
Connectors
Plug and play Kafka, S3, and GCS

Developer Experience

Instant SQL APIs
Turn SQL into an endpoint
BI & Tool Connections
Connect your BI tools and ORMs
Tinybird Code
Ingest and query from your terminal

Enterprise

Tinybird AI
AI resources for LLMs and agents
High availability
Fault-tolerance and auto failovers
Security and compliance
Certified SOC 2 Type II for enterprise
PricingDocs
Resources []

Learn

Blog
Musings on transformations, tables and everything in between
Customer Stories
We help software teams ship features with massive data sets
Videos
Learn how to use Tinybird with our videos
ClickHouse for Developers
Understand ClickHouse with our video series

Build

Templates
Explore our collection of templates
Tinybird Builds
We build stuff live with Tinybird and our partners
Changelog
The latest updates to Tinybird

Community

Slack Community
Join our Slack community to get help and share your ideas
Open Source Program
Get help adding Tinybird to your open source project
Schema > Evolution
Join the most read technical biweekly engineering newsletter
Back to Blog
Share this article:
Back

Automating customer usage alerts with Tinybird and Make

Here's how I used "low-code" analytics and automation to help my team be more proactive.
I Built This!
David Margulies
David MarguliesSales Engineer

Tinybird is a data company. I mean that in two ways: we are building a real-time data platform, and we use data every day to improve how we operate as a business.

We like to think we always choose the perfect technology and implement the most brilliantly automated workflows to get immense value out of all the data we collect.

But the reality for our fast-moving startup is that often we do something hacky and manual to process our data for the insight we need at that moment in time. Unfortunately, hacks and manual workflows can fail and become an inefficient time drain in the future.

To avoid that time drain, it can feel like there are only two options:

  1. Buy an off-the-shelf SaaS to do the job. This can be fast, but depending on the job to be done, you might not find a SaaS that can do it exactly how you want it, and if you can, it’s probably expensive.
  2. Ask your engineering or product team to build something for you. Developer-led companies love the DIY approach, but it can be expensive (in terms of resource time and opportunity cost) and most often is not well-maintained.

There is, however, a third option: No-code/low-code tools. These unique SaaS platforms let non-technical or semi-technical people (aka me) build automated workflows that might otherwise require developers.

No-code/low-code tools give people without engineering skills the autonomy to build valuable end-to-end applications.

I’m a proud supporter of no-code/low-code tools. I have no problem building complex data pipelines, but developing applications is not in my wheelhouse. Low code tools give me the autonomy to build an end-to-end application that help me, my team, and my company move forward.

In this blog post, I’ll share how I used low-code tools to build an automation that allowed our sales teams to have better, more informed conversations with our customers.

The context

As a Sales Engineer at Tinybird, I straddle the line between Sales and Customer Data Engineering. I collaborate with Account Executives (AEs) to provide technical guidance in the early stages of a customer’s journey, and then help transition the customer into the capable hands of a Data Engineer who can expertly guide them into production.

Part of my job is to help our enterprise customers appropriately size their use cases before they sign a contract. I seek to understand their usage patterns so that I can model their costs and work with our AEs to create a commercial plan based on what we think they will need. After the contract is signed, we then monitor their usage against the commercial plan to make sure they stay on target.

But, I quickly discovered a chasm between pre-sales usage sizing and post-sales usage monitoring.

Our Data Engineers are highly-trained optimizers maniacally focused on knocking down technical barriers for our customers. They allow our customers to do more and move faster.

On the other hand, the AEs care deeply about the financial bits of the customer relationship. A happy customer is a repeat customer, and the AEs want to know how each customer is operating against their commercial plan so they make sure they’re getting value out of the product.

Every time an Account Executive wanted to check in on a customer's usage, they had to bug our Data Engineers. Which means they didn't do it, and the customer relationship suffered.

Unfortunately, every time an AE wanted to get those usage numbers, they’d have to manually hunt it down and bug a Data Engineer.

For an early-stage startup, the manual process is the likely and logical solution. When you don’t have many customers, you can communicate across teams and get your answers without too much trouble.

But, as you scale, the manual process becomes inefficient. In our experience, AEs were losing track of their customers’ utilization. If they weren’t checking early and often, they could miss an important milestone or an opportunity to bring more value. At best, our AEs couldn’t be as proactive as they wanted to be. At worst, we put the customer relationship at risk.

We knew we could do better. We already had all of the data. The problem was that nothing was automatically combining the two and proactively doing something with the information.

We had the data to be able to notify our sales team when customers hit usage milestones. We just needed somebody to do something with it.

We needed somebody to solve this problem. Somebody who bridges the gap between Sales and Data Engineering…

Gif of Adam Sandler: "Who me?"
Who me?

Yes me.

Read on to learn how I solved this problem. If you're new to Tinybird, you can learn more about it here. In a nutshell, Tinybird is a real-time data platform that empowers data teams, developers, and even semi-technical folks like me to ingest large amounts of data from a variety of sources, query and shape it with 100% pure SQL, and publish queries as low-latency, secure APIs. You can sign up for free if you're interested.

The tools

Tinybird isn’t by definition a no-code/low-code tool, but since SQL is the only thing you really need to know to ingest data, shape it, and publish it as APIs, it can sometimes feel that way.

Since I already had the data in Tinybird, I could generate the metrics that I needed with nothing but SQL (which is in my wheelhouse), and then instantly publish those metrics as APIs to share them with external applications.

Make is a no-code platform for building automation in a drag-and-drop UI. It has connectors for just about everything, and it handles all of the backend scheduling and compute infrastructure. Just what I needed to quickly and reliably build this solution.

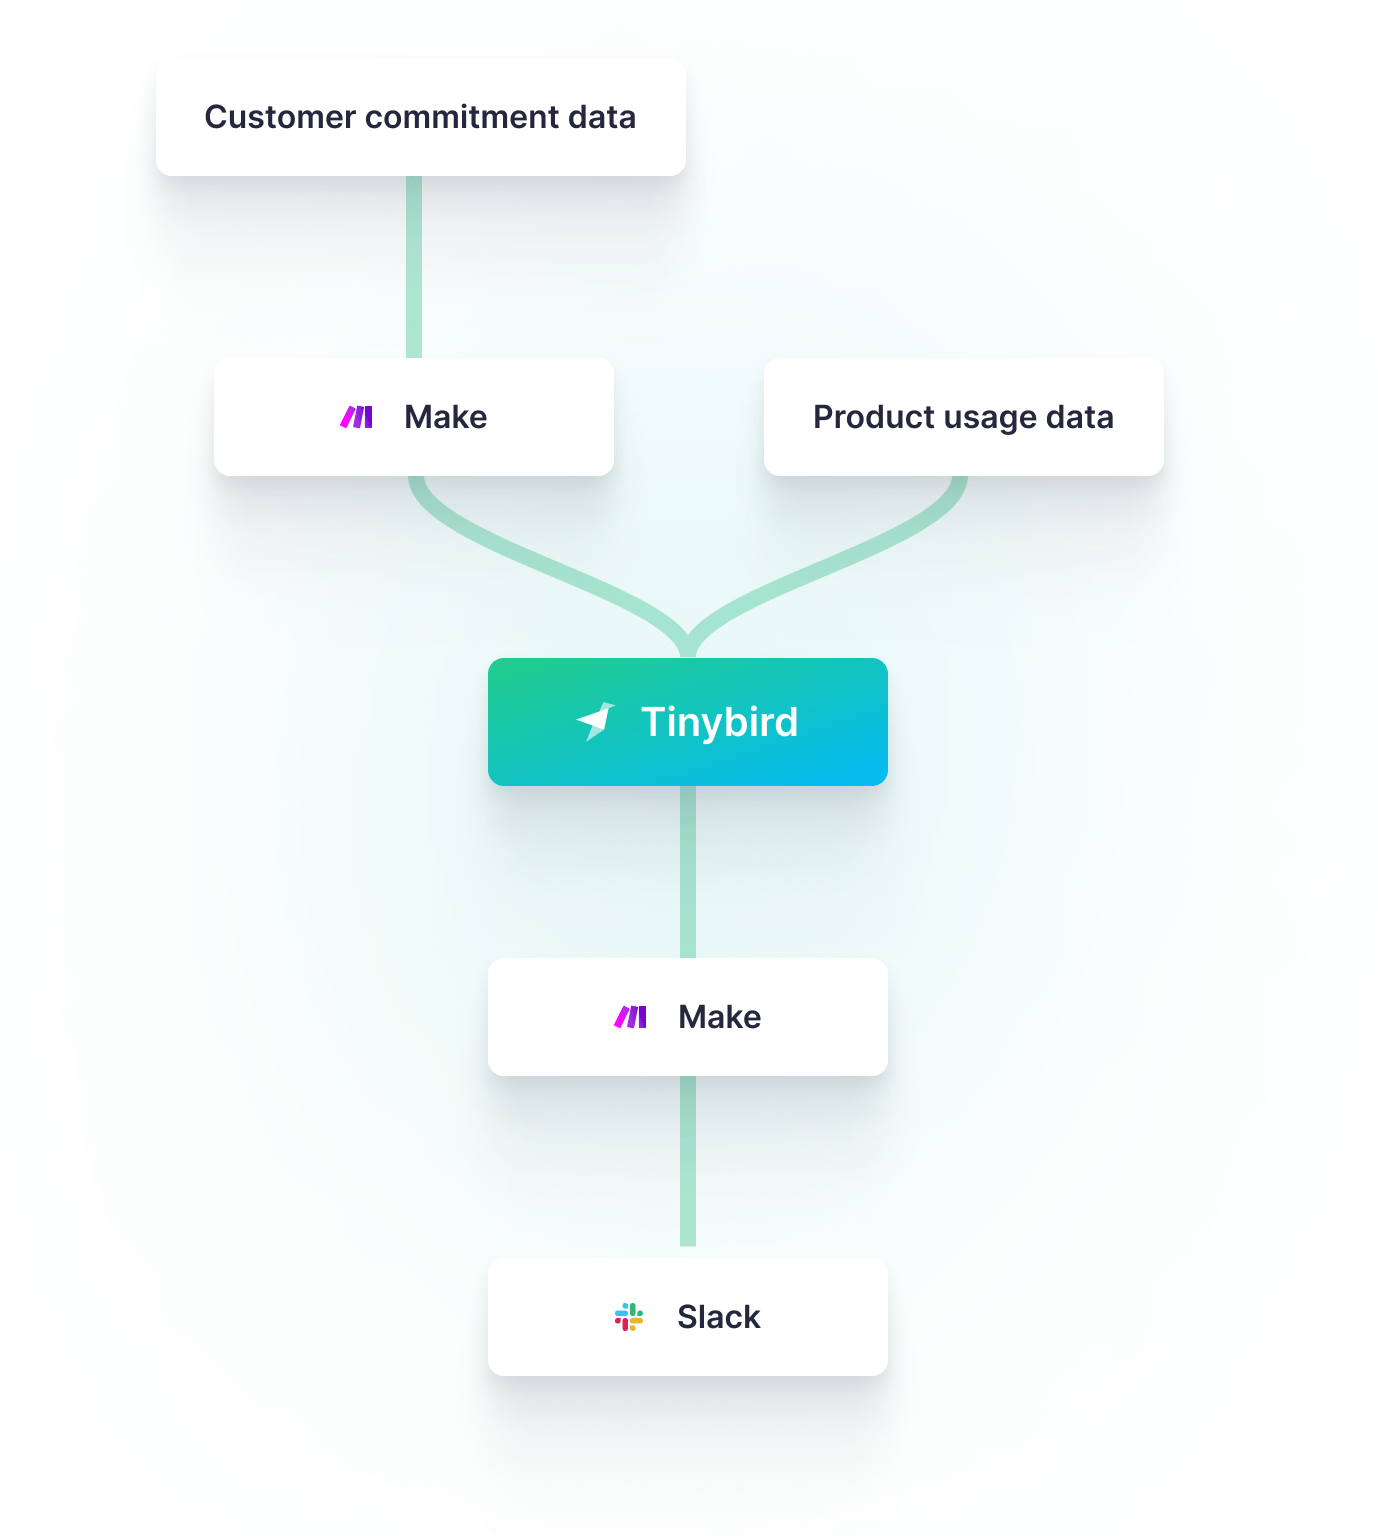
I used Tinybird to ingest customer usage and commitment data from multiple sources then query it with SQL and publish those queries as APIs. I used Make to call those APIs on a schedule and notify our sales team through Slack if customers exceed usage thresholds.

Here’s how I used Tinybird and Make to notify our Sales team through Slack when a customer passed a usage milestone against their enterprise plan.

A screenshot of a Slack message generated by a Make automation indicating that customer usage has exceeded a threshold
An example of the alert that gets created in Slack when a customer hits a usage milestone.

The architecture

This project consisted of three components:

  1. A Make scenario to continuously send data from Salesforce to Tinybird
  2. A Tinybird data project to temporarily store the incoming data, analyze it for potential alerts, and publish the analysis as an API Endpoint,
  3. A Make scenario to consume the Endpoint and generate Slack alerts when necessary.
I used Tinybird to ingest and analyze customer usage data and commercial plan data and publish the metrics I needed as APIs, then I used Make to call my Tinybird APIs and send a Slack notification if customer usage passed an important milestone.

Sending data from Salesforce to Tinybird

The first step was to get both sources of data - customer commitment and product usage - into Tinybird.

Luckily, the product usage data was already available in Tinybird (we use it for operational analytics and billing), so I didn’t have to do anything there.

To get the customer commitment data into Tinybird, I needed to build an automation to pull data from Salesforce and send it to Tinybird. I used Make’s Salesforce, CSV, and HTTP modules to build this simple workflow:

‍

A screenshot of a Make scenario which gathers customer data from Salesforce and uploads it to Tinybird
My first scenario in Make retrieved data from Salesforce, formatted it as a CSV, and then uploaded it to Tinybird using the Data Sources API.
  1. Get the customer commitment data from Salesforce
  2. Iterate through the customers to get the account owner ID
  3. Get the account owner’s Slack username (you’ll see why later)
  4. Format the data as CSV
  5. Post the CSV file to Tinybird using the Data Sources API

Tinybird’s Data Sources API made this very easy, as it’s a simple HTTP request to post a CSV file, and Tinybird will immediately write it into a Data Source that I can then query over. Here’s a curl example of the HTTP request I issue in Make:

Comparing usage to commitment with SQL

With the data collected, my next task was to compare the actual usage against the commitment so I could decide when an alert needed to be created. To do that, I started writing some SQL in Tinybird.

Tinybird usage is priced based on processed data and storage in each Workspace. Enterprise customers often have multiple Workspaces, so I would need to sum usage across all of a customer’s Workspaces. This would make my SQL quite complex, requiring multiple steps and subqueries. Writing big, complex queries is painful.

Thankfully, Tinybird Pipes minimize that pain. Pipes let you break down complex queries into nodes chained nodes of SQL. Each subsequent node can query over prior nodes. With Pipes, I could logically break my flow down into smaller, more manageable pieces.

Tinybird Pipes let you break large spaghetti queries into smaller, more consumable nodes of SQL. It's easier to write and debug, so you can move faster.

The logic of my SQL is below. Each code snippet is a subsequent node in my Tinybird Pipe.

  1. Get all the Workspaces for each Organization. This query returns all the Workspaces in a Tinybird internal Data Source that have an organization_id that matches one of our enterprise customers in Salesforce.
  1. Calculate actual data processed per Organization. This query returns the contract start date (selected from the table of Salesforce commitment data) and the amount of data that has been processed in all Workspaces belonging to each Organization. You can see how it joins the internal billing log with the results from the node above.
  1. Calculate actual storage per Organization. Similar to the above query, but for using storage logs, not processed logs. Note that Tinybird bills for storage based on the amount of data stored at the end of the contract period.
  1. Combine actual and commitment usage into a single result, with additional information about the assigned AE and the calculated progress (actual/commit) against the plan. This ended up being multiple nodes of SQL to get actual numbers for processed data, storage data, and UNION the results in a final result table. The final node that pulled it all together looks something like this:
  1. Filter only Organizations above an alert threshold. You’ll notice I used the Tinybird templating language in the WHERE condition to create a query parameter, so that I could pass a dynamic threshold to the query when I published it as an API (more on that soon).

One more twist: once a customer passed a milestone, this query would have returned that customer every time it was run (or until the commitment details changed). I only wanted to return that customer on the day that they passed the milestone, so I modified the query to calculate usage for yesterday and today. Then, I changed the filter behavior to only return those customers where usage was below the milestone yesterday and above the milestone today:

Publishing APIs from SQL queries

Once I finalized the SQL query, I simply had to click a button to publish a low-latency HTTP API Endpoint that returned any customers that reached a milestone.

A gif showing how to publish SQL queries as APIs in Tinybird
With Tinybird, publishing APIs from SQL is a cakewalk.

Automating alerts with Make

The last step was to create an automated workflow to hit the Tinybird API Endpoint and send an alert to Slack when a customer reached a milestone.

Using Make’s default HTTP and Slack modules, it was a breeze to build a production-ready scenario in minutes.

‍

A screenshot showing a scenario in Make that loops over usage thresholds, calls a Tinybird API, and generates a Slack notification if customer usage exceeds a threshold.
My scenario in Make used a loop to pass a commitment threshold percentage (e.g. 50) as a query parameter to my Tinybird APIs. Depending on the result, I'd generate a Slack message to notify our Account Executives.

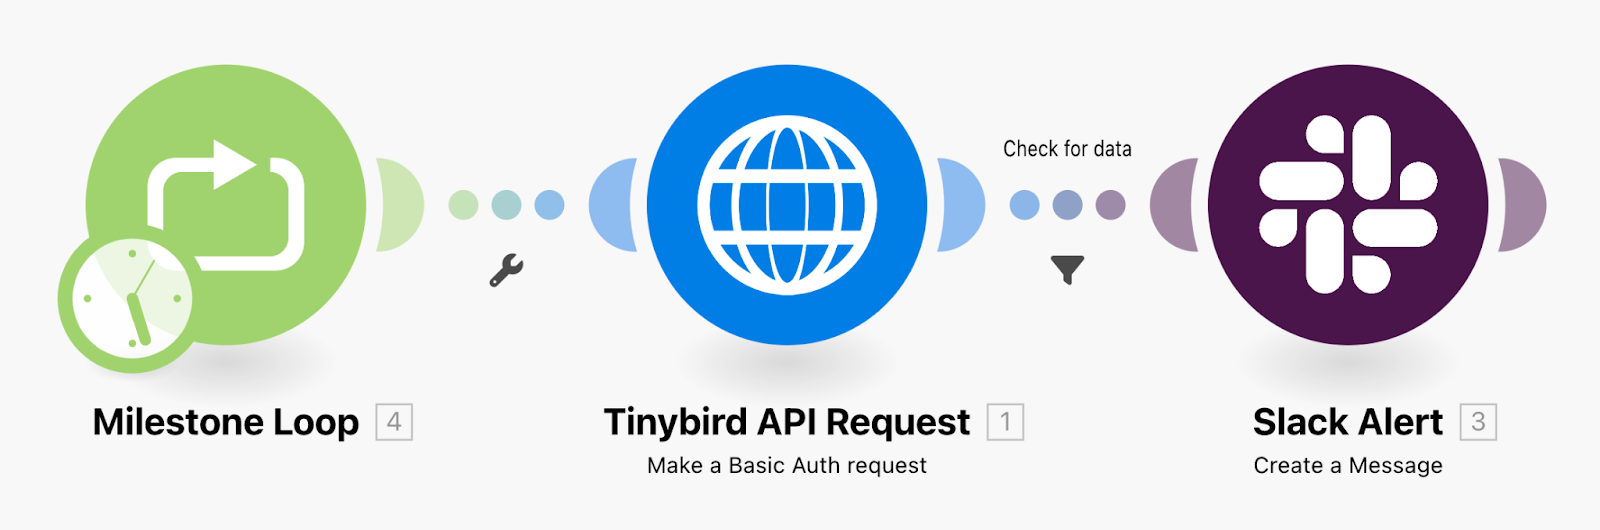
The automation runs on a daily basis and works like this:

  1. Set the milestone parameter to 50% in the Loop module
  2. Send an HTTP GET request to the Tinybird API Endpoint, returning any customers that reached the milestone
  3. Check if any data was returned - if no data, then stop
  4. If there is data, then send an alert to Slack with the usage details
  5. Tag the Account Owner so they can take immediate action
  6. Increment the milestone by 10%, and continue the loop until it passes 100%
A screeshot of an automated Slack alert to notify our team about customer usage milestones.
In less than one day, I combined the power of Tinybird and Make to create an automatic alert that enabled our Sales team to be more proactive in tracking customers’ usage.

Thanks to these two tools, SQL was the only hard skill that I needed to build something valuable for me team. And since I'm pretty experienced with SQL, I knocked this entire project out in a single day.

If you're new to Tinybird and want to try it out, you can sign up here. The Build Plan is free forever, with no time limit and no credit card required. Feel free to join our community on Slack if you have any questions for me or our whole team, or if you'd like to offer any feedback.

Do you like this post? Spread it!

Skip the infra work. Deploy your first ClickHouse
project now

Get started for freeRead the docs
A geometric decoration with a matrix of rectangles.
Tinybird wordmark

Product /

ProductWatch the demoPricingSecurityRequest a demo

Company /

About UsPartnersShopCareers

Features /

Managed ClickHouseStreaming IngestionSchema IterationConnectorsInstant SQL APIsBI & Tool ConnectionsTinybird CodeTinybird AIHigh AvailabilitySecurity & Compliance

Support /

DocsSupportTroubleshootingCommunityChangelog

Resources /

ObservabilityBlogCustomer StoriesTemplatesTinybird BuildsTinybird for StartupsRSS FeedNewsletter

Integrations /

Apache KafkaConfluent CloudRedpandaGoogle BigQuerySnowflakePostgres Table FunctionAmazon DynamoDBAmazon S3

Use Cases /

User-facing dashboardsReal-time Change Data Capture (CDC)Gaming analyticsWeb analyticsReal-time personalizationUser-generated content (UGC) analyticsContent recommendation systemsVector search
All systems operational

Copyright © 2025 Tinybird. All rights reserved

|

Terms & conditionsCookiesTrust CenterCompliance Helpline

Related posts

I Built This!
Nov 06, 2023
Build a real-time dashboard in Python with Tinybird and Dash
Cameron Archer
Cameron ArcherTech Writer
1Build a real-time dashboard in Python with Tinybird and Dash
I Built This!
May 11, 2023
Building privacy-first native app telemetry with Guilherme Oenning
Tinybird
TinybirdTeam
1Building privacy-first native app telemetry with Guilherme Oenning
I Built This!
Feb 13, 2025
Build a data-intensive Next.js app with Tinybird and Cursor
Cameron Archer
Cameron ArcherTech Writer
1Build a data-intensive Next.js app with Tinybird and Cursor
I Built This!
Oct 17, 2025
Building real-time, generative UIs for analytics with Tinybird and Thesys
Zahle K.
Zahle K.Founding Engineer at Thesys
1Building real-time, generative UIs for analytics with Tinybird and Thesys
I Built This!
Jan 04, 2022
Operational Analytics in Real Time with Tinybird and Retool
Alison Davey
Alison DaveyDeveloper Advocate
1Operational Analytics in Real Time with Tinybird and Retool
I Built This!
Dec 06, 2022
Measuring World Cup sentiment with Twitter and Tinybird
Cameron Archer
Cameron ArcherTech Writer
1Measuring World Cup sentiment with Twitter and Tinybird
I Built This!
May 05, 2023
Low-code analytics with James Devonport of UserLoop
Tinybird
TinybirdTeam
1Low-code analytics with James Devonport of UserLoop
I Built This!
May 20, 2025
IoT monitoring with Kafka and Tinybird
Gonzalo Gómez
Gonzalo GómezSoftware Engineer
1IoT monitoring with Kafka and Tinybird
I Built This!
May 12, 2023
Upgrading short link analytics by 100x with Steven Tey
Tinybird
TinybirdTeam
1Upgrading short link analytics by 100x with Steven Tey
I Built This!
Jun 06, 2024
Building real-time leaderboards with Tinybird
Jim Moffitt
Jim MoffittDeveloper Advocate
1Building real-time leaderboards with Tinybird