


This is the second post in a series of articles that explains how I’ve replaced Google Analytics with a DIY web analytics platform built with a little bit of JavaScript, Tinybird, and Retool. Check out the first post, which explains how I capture the web events data that powers my visualizations in Retool, and it provides some context for why I’d want to replace Google Analytics in the first place.
In this post, I’m going to explain how I used Retool and Tinybird to recreate one of my favorite Google Analytics views: the Content Drilldown.
What is the Content Drilldown?
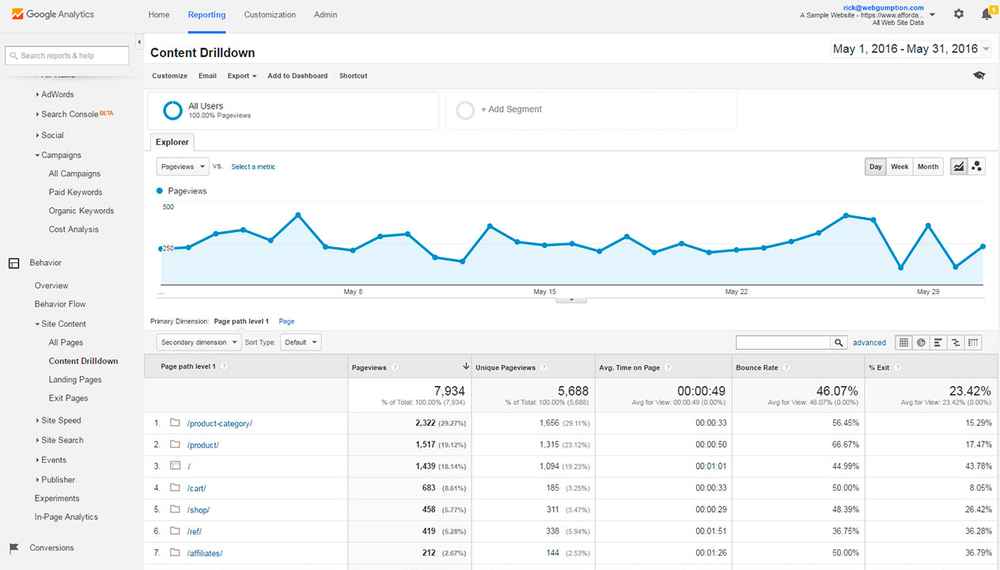
The Content Drilldown is a view in Google Analytics Universal Properties that lets you explore critical metrics for the various subdirectories on your website’s domain. If we used Google Analytics to track Tinybird website visits (we don’t), the Content Drilldown would allow me to see aggregated session metrics—in a single row—for all traffic that visited that page path.
For example, all of Tinybird’s blog posts are contained in the subdirectory “/blog-posts/”. Every blog post will have the same URL structure: “https://tinybird.co/blog-posts/blog-post-slug”. In this case, the Content Drilldown would let me view session metrics for my entire blog, not just individual blog posts.
Here’s a decent primer on the Content Drilldown if you want more detail.
How does the Content Drilldown work?
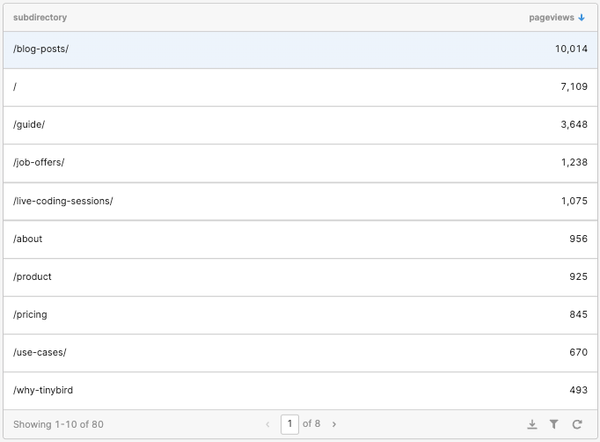
When you land on the Content Drilldown in Google Analytics, you see a list of subdirectories and individual pages on your domain, including the homepage, ranked by the total number of pageviews for that page path over the specified time period. If you click on one of those subfolders or pages, the view will update to show the aggregate metrics within that page path. You can continue down this journey until you’re at the individual page level.
This video shows the Content Drilldown behavior in more detail, if you’re interested.
How I recreated the Content Drilldown with Retool and Tinybird
Because the Content Drilldown has been very useful to me in my career as a Content Marketer, and because we at Tinybird have transitioned away from Google Analytics for data privacy reasons (among others), I decided to recreate a basic version of this view using Retool and Tinybird. This was a great learning process for me, with a lot of trial and error. Here’s how I made it work.
Step 0: Do it without a session cookie
In my last post, I structured the data I was capturing from my website into discrete sessions. This was useful to capture session metrics like bounce rate and exit %, but in this case, I just built a Content Drilldown for individual pageviews. I reasoned I could always expand it later if I wanted to.
I liked this approach for two reasons. For one, it was just easier to implement. Less code. But it’s also a more privacy-first approach. If you can avoid using cookies for your use case, even session cookies, you’re more likely to have a bulletproof case for compliance with data privacy laws like GDPR. Did I mention it’s also easier??
Step 1: Define the logic in Tinybird
In case you missed the first post, the Tinybird website is equipped with a first-party tracker. This is just a bit of JavaScript that is hosted on the Tinybird domain and sends web events data like pageviews directly into a Tinybird data source using the Tinybird Events API.
Once the data hits the Tinybird data source, I can analyze and transform the data using SQL in Tinybird Pipes, a series of chained, composable SQL nodes. With Pipes, each subsequent node can query over the prior node, which means you can avoid building massive queries with nested CTEs.
Any node in a Pipe can be published as a REST API, which lets you easily get the results of your queries using any requests library in whatever frontend you’re building. In this case, I can use the API endpoints I create from my Pipes as Resource Queries in Retool.
In the case of the Content Drilldown, I wanted the final node of my Pipe to return a list of subdirectories on the Tinybird website ranked by total pageviews within that subdirectory over the specified time period. In addition, I wanted to see a chart of those pageviews over time.
It took me a while to figure out the right approach here. My first challenge was simply understanding how the Content Drilldown works, theoretically. I have quite a few ripped-up, balled-up notepad sheets in my digital wastebasket to show for this.
But I figured it out eventually. Here’s how it went:
Step 1A: Get pageviews under the selected page path
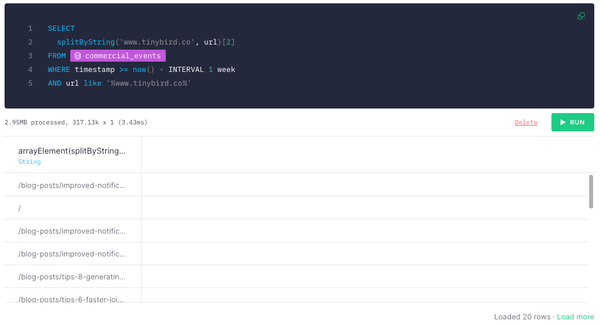
What I decided to do first was split every URL by the selected page path, filter URLs that only matched the selected page, only retain the trailing substring of the URL. This would match the basic functionality of Google Analytics.
Here’s an example of some SQL in Tinybird that does that for the root domain for the last week of events data, for example:
… and the results in Tinybird. Each row is a single pageview event that matches the substring.
Notes:
splitByString()is a ClickHouse® function that returns an array of substrings split by a designated separator. SosplitByString(‘www.tinybird.co’,’www.tinybird.co/blog-posts/this-is-a-blog-post’)would return[‘’, ‘/blog-posts/this-is-a-blog-post’].
Step 1B: Extract subdirectories and single pages
Once I had the results from the above query (every pageview event under the selected page path), the next step was to aggregate pageviews by the subsequent page path level.
Since the selected directory could always include pages or additional subdirectories, I need a way to tell them apart. Simple: Look for URLs containing more than one forward slash (‘/’). Those with more than one slash would represent a page within a subsequent subdirectory. Those with just one slash would represent a page within the selected directory.
Here’s how I did that one in Tinybird SQL:
Note this is the second node in the Pipe, querying over the results in the first node (which I named “clean_path”).
Here’s what’s happening in that first SELECT statement:
First, I’m using the ClickHouse® function extract() which returns a fragment of a string using a regular expression. The regex pattern \/.*?\/ indicates I want the first fragment in between two forward slashes. If no such fragment exists because there’s only one forward slash (i.e. it’s a page and not a subdirectory), then this returns an empty string.
In the case of an empty string, I set it to null with the nullIf() function and used the coalesce() function to return the page path.
With this SELECT statement, I get the part of the URL within two forward slashes (if it’s a subdirectory), or the page slug (if it’s not).
There are probably other ways to do this, and ClickHouse® offers a bevy of functions for extracting URL parts, but I was just happy I got this to work!
From there, it was just a simple count aggregation.
Step 1C: Add query parameters
As the name implies, the ability to drill down into subsequent page path levels is a critical part of the Content Drilldown. When you click a subdirectory displayed as a row in the table of the Content Drilldown, the table updates to show aggregate pageviews within that path. I wanted to implement the same functionality in Retool, which meant I’d need to pass a parameter to my resource query to let it know where to “split” the path. I’d also need query parameters to define the date range.
The next step, then, was to add query parameters in Tinybird using Tinybird’s templating language. Here’s how the clean_path node looked once updated with query parameters:
Notes:
- Anything inside of double curly braces is a parameter that I can use when I call an endpoint published from this Pipe. I’ve defined 3 query parameters:
split,start_datetime, andend_datetime. The latter two are self-explanatory. Thesplitquery parameter let me define how I split the URL based on my selected page path in the Content Drilldown. - I cleaned up the URL by removing URL parameters (
?), anchor tags (#), and trailing slashes. - As in my prior post,
{if defined()}let me only execute the subsequent SQL statement if a value is passed for the query parameter. So I only filtered out events afterend_datetimeif that query parameter was defined. - I also made sure to filter out any pages that didn’t include the defined page path with that last
ANDstatement. This used the samesplitquery parameter.
Step 1D: Publish the Tinybird endpoint
Tinybird makes it as easy as possible to publish the results of these queries as API endpoints. It’s a single click. So I just published the final node in that Pipe as an API:
That’s it! With the endpoint published, it was time to step into Retool.
Step 2: Build the Content Drilldown in Retool
Before I explain how I recreated the Content Drilldown, let me show you what I built. Here’s what the final product looks like in Retool:
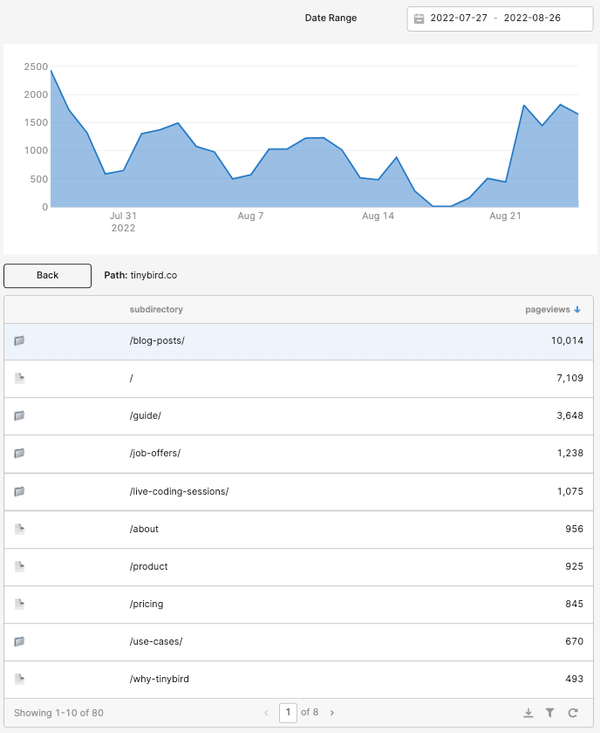
It’s a decently faithful facsimile of the original Content Drilldown in Google Analytics, albeit with fewer columns. And now, how I did it:
Step 2A: Create the datepicker
I won’t spend a bunch of time here, as this was simple in Retool. I needed a simple data range selector over which to aggregate the metrics. Retool has a built-in React datepicker component, so I just dragged that into my Retool canvas and set the default start date to 30 days ago and default end date to today using the moment() function:
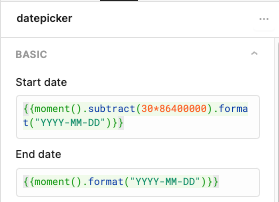
The formatting is so the values would play nice with my Tinybird APIs, since I’d use these as query parameters later.
Step 2B: Create the basic drilldown table
To start, I dragged a table component into the canvas, and set up the resource to populate the table with data by calling the Tinybird API I published.
Here’s that RESTQuery resource, called content_drilldown:
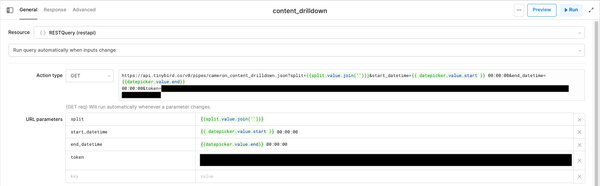
This also involved creating a temporary state in Retool to store the value of the split query parameter and update it upon drill down. I decided to define this as an array (I’ll explain why later), and I set the default value to our root domain: [“www.tinybird.co”].
Then I used the value of that temporary state (joining the array elements into a single string) for the split query parameter in the Tinybird API. Finally, I updated the table component to get data from the Resource Query:
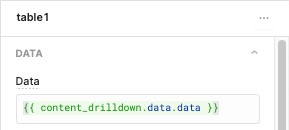
And here’s how it looked:
Good start! Now for the hard part.
Step 2C: Implementing the drilldown functionality
Here’s a summary of what the table should do to mimic Content Drilldown in Google Analytics:
- When you click on a page path (row in the table), the table should update to only show aggregated data underneath that page path.
- You need to be able to “back out” of the drilldown.
- When you drill down, the table should reset to the first page.
- Show the current page path
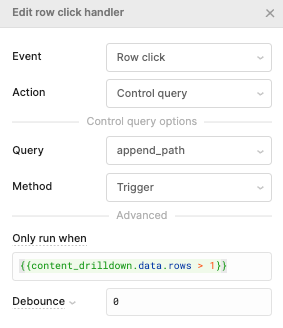
I started with #1 by adding a “row click” Event Handler to the table, so that when I clicked a row in the table, it would drill down to content underneath that path by appending the clicked subdirectory to the split temporary state.
To do that, I created a JavaScript Query that I named “append_path” in Retool with the following code
That second line of JS handles #3 in my list above.
I then updated the Event Handler to run that resource when a row in the table was clicked. I also added a filter so the script wouldn’t run once you reach the end of the path (a single page) and can’t drill down anymore.
With that, the drilldown functionality started to take shape:
But once I drilled down, I couldn’t come back up! Enter the “Back” Button.
Step 3D: Create a back button, and other ornaments
I dragged a Button component onto the canvas, and I created a new JavaScript Query called “drop_path” with this code:
This is why I used an array for my temporary state. I could just drop the last element to go back up the page path, rather than needing to parse strings.
I also created a simple text element to display the current path (split.value.join(‘’)).
And finally, just for fun, I added a column to identify whether each row in the table was a page or another subdirectory, in the same way Google Analytics does.
Looking good now!
Step 2D: Create the chart
The final element of the Content Drilldown is the chart showing aggregated pageviews over time for the entire selected subdirectory.
To do this, I actually needed a new Tinybird Endpoint, since my first one didn’t return the metrics grouped by day.
This was easy in Tinybird. I duplicated my Pipe from the Step 1, and updated the SQL in the published node to the following:
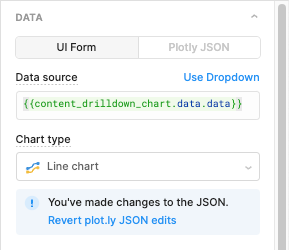
I then added this to Retool as another Resource Query called “content_drilldown_chart”.
I dragged a Chart component onto the Canvas, defined the data source, and made some slight updates to the Plotly JSON to remove the markers:
And that’s the last of it! Here’s how the final app ended up looking:
I’m pretty pleased with this. It gave me exactly what I needed: A way to explore how visitors interact with the various subdirectories on our site, and how those subdirectories perform over time.