


What’s changed?
We have enriched our pipe_stats_rt service Data Source by including the data processed for every request and the token information, as well as other information related to the actual request. The new columns are:
pipe_name: name of the requested piperead_bytes: bytes processed for the requestread_rows: number of rows read in the requestrequest_id: identifies the requesttoken: the id of the tokentoken_name: the name of the token
Also, the service Data Source pipe_stats (with aggregations per day) has been extended by providing two new columns:
pipe_name: name of the requested piperead_bytes_sum: bytes processed for the requestread_rows_sum: number of rows read in the request
QueryAPI requests are included too. Just use the query_api value to filter by pipe_id or pipe_name.
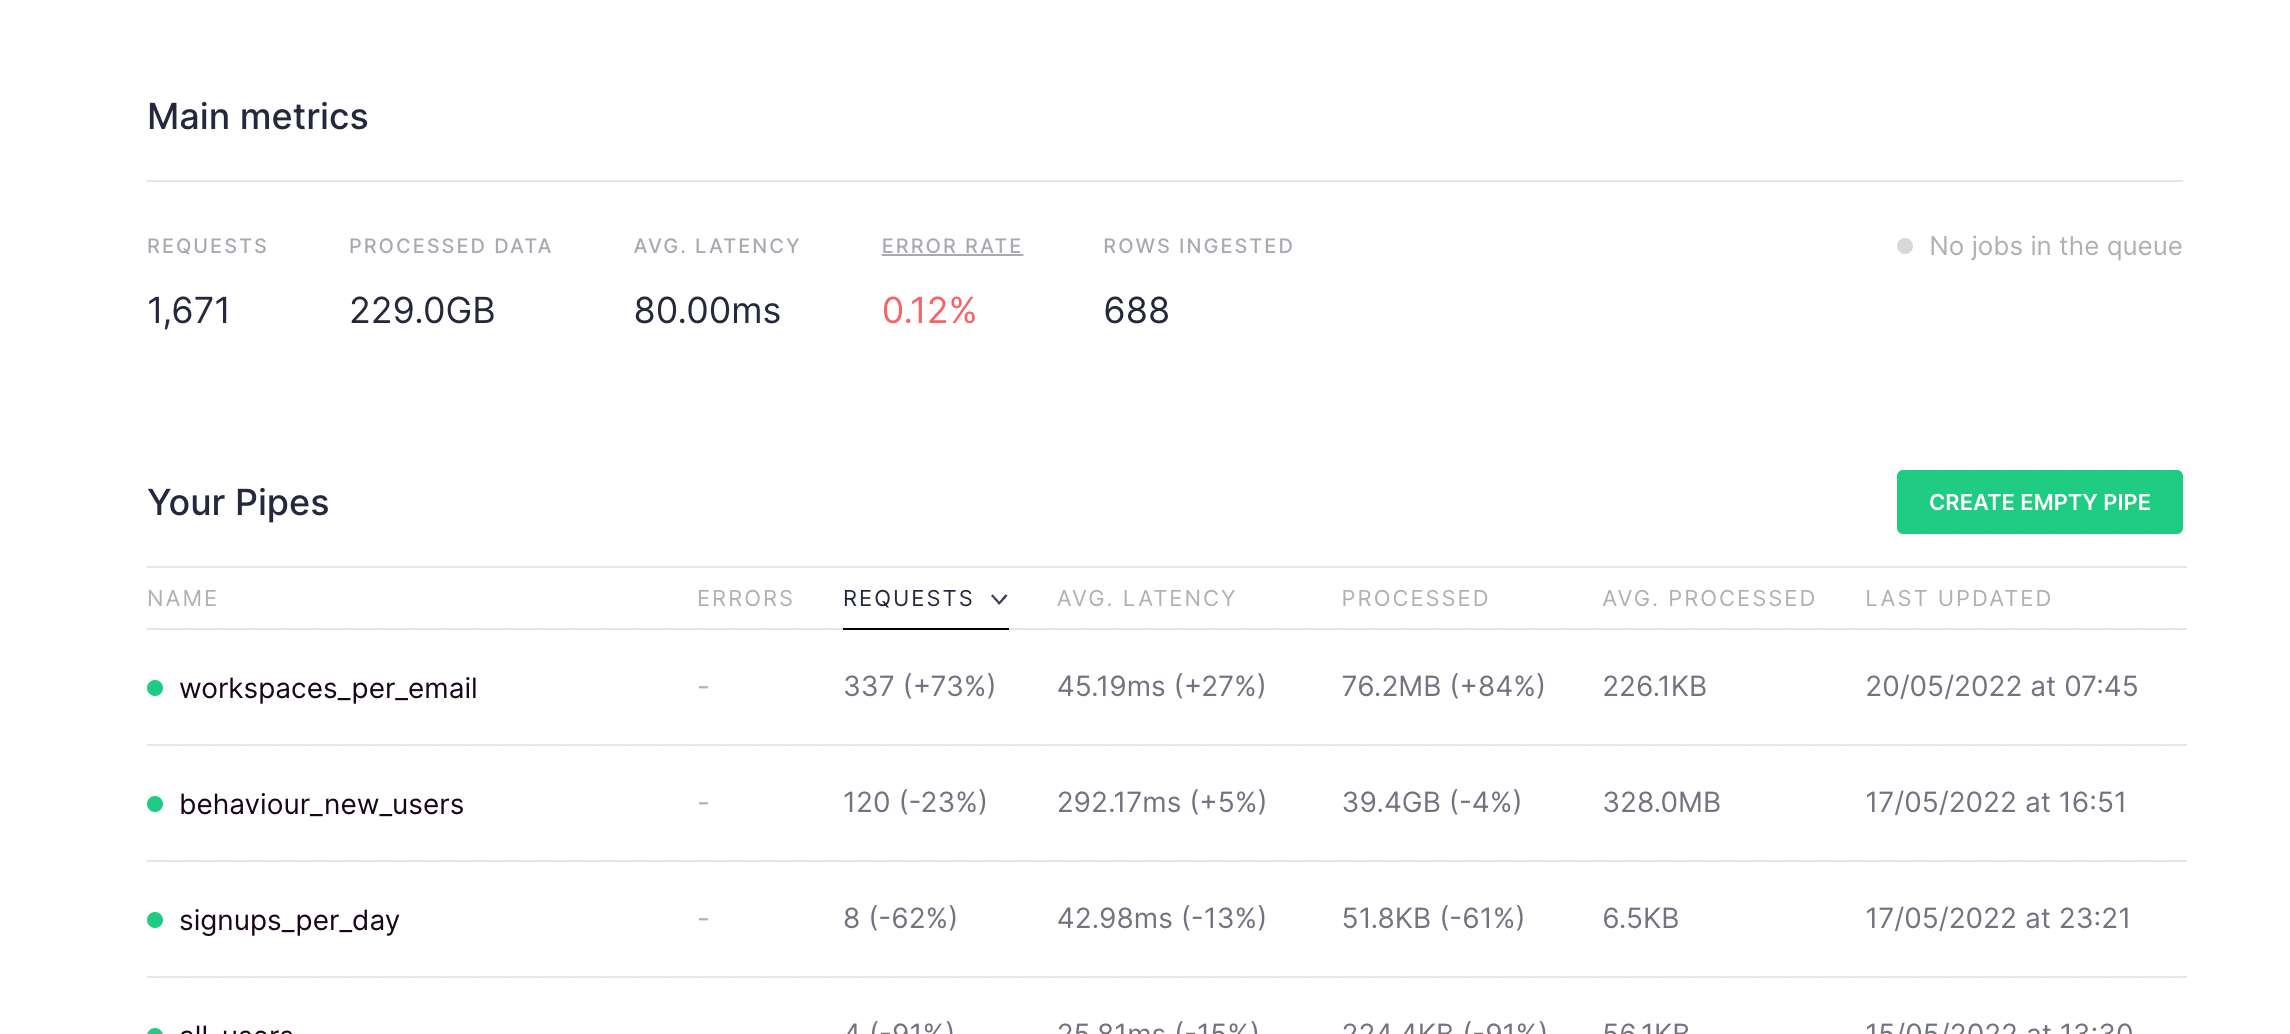
Finally, since we’ve improved pipe_stats_rt, we figured we’d offer an easy way to explore that performance in the Tinybird UI. If you want to compare all your published Pipes, in the dashboard we have included the average and the total processed data:
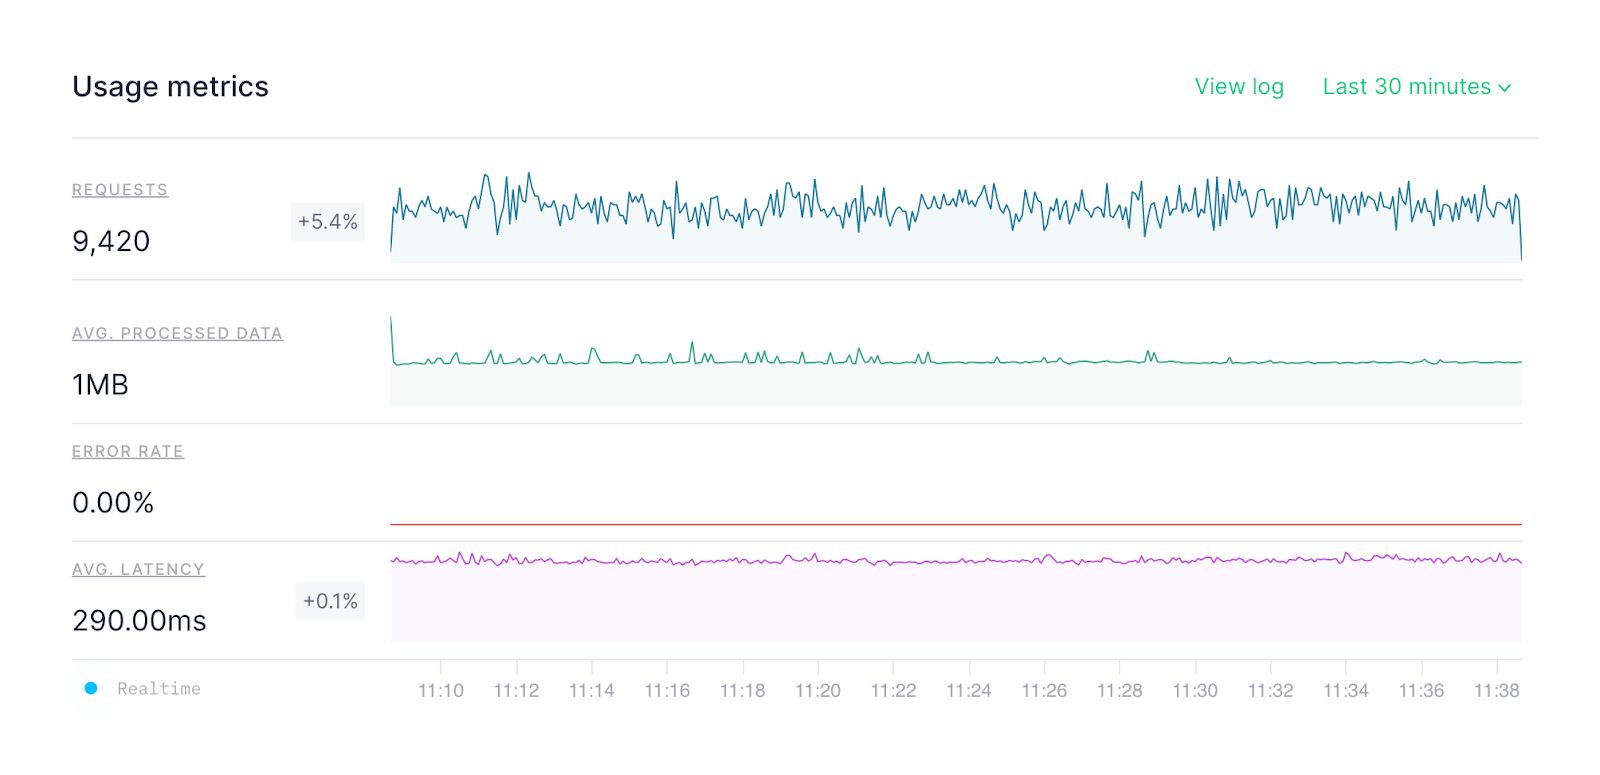
And, if you want to check just one Pipe in detail, you’ll now find a graph showing the average processed data over time on the API endpoint’s information page. Use this graph to check usage in real-time and compare performance across time periods.
Why does this matter?
First of all, the upgrade to pipe_stats_rt means you can now create service Endpoints to monitor the amount of data processed on your Workspace. This is big news.
In addition:
- You can identify which endpoints and requests are consuming the most data, so you can optimize them.
- You can spot tokens that may have been leaked.
- You can find endpoint parameters that consume comparatively more data.
- You can detect changes in endpoints by looking at the scan size.
Get Started with the guide
Ready to optimize your endpoints? Some of these examples are available in the guide we have prepared for analyzing the performance and consumption of your API Endpoints.