


Everyone's talking about AI agents that can analyze your data and answer business questions. The vision is compelling: just ask "Why did revenue drop last week?" and get an intelligent, contextual answer.
But here's the reality: LLMs are surprisingly bad at working with analytical data. It's not just a "big data" problem; they struggle even to figure out what they're being asked and where to look in your database. The challenges of LLM analytics are real and pervasive across the industry. If you're building agentic analytics experiences, you're going to hit those walls fast.
Some of the problems marketers don't talk about
LLMs struggle with tabular data
Every LLM was trained on billions of words, learning to predict what comes next in a sentence. But analytical data doesn't follow narrative patterns. A 50-column table isn't a story, it's a multidimensional relationship map where correlations matter more than sequence.
Show an LLM a comma-separated table detailing sales performance, and it will try to parse it like prose; likely missing the relationships that drive meaning and valuable inference.
SQL generation is hit-or-miss
Despite all the hype, LLMs rarely write perfect SQL on the first try. We've seen this in our own LLM SQL benchmark, but don't take our word for it. Stanford research figured out early that even top performing language models struggle significantly with complex SQL generation, especially for joins and database-specific syntax. Understanding the limitations of modern analytics tools natural language SQL generation is crucial for building reliable systems. This is a key area of LLM analytics research.
Long running analytical queries kill the agentic experience
In analytics, you're querying massive tables. A poorly written query can run for minutes or consume enormous resources. That's not just expensive, it's a frustrating user experience. Users expect agents to respond in seconds, not after a coffee break.
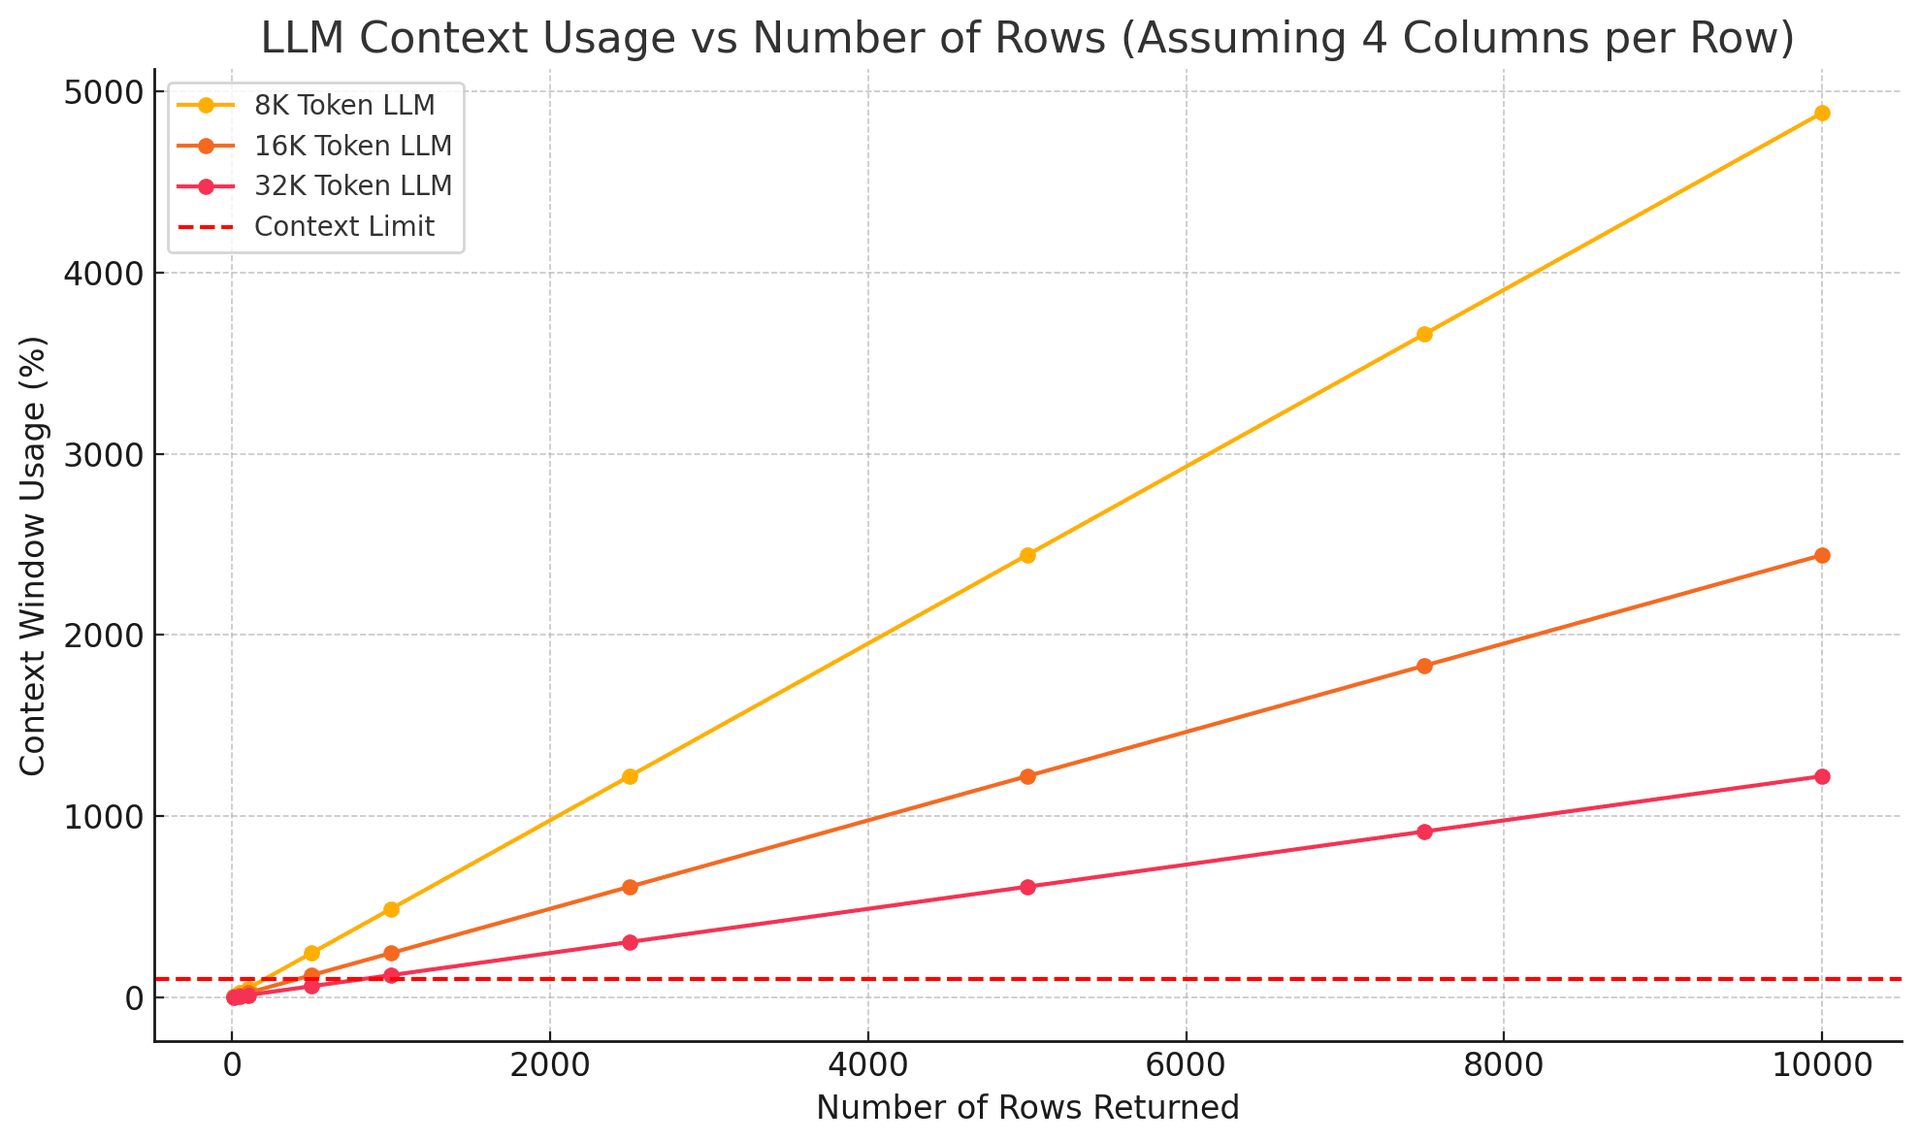
The context window exhaustion problem
If your prompts (or the tools you ask the LLM to use) aren't well designed, the amount of data returned can easily exhaust context windows. Ask for "top customers by revenue" and you might get back 10,000 rows. LLMs can't process that volume effectively, and users certainly can't consume it.
Your data is too complex
Databases, data lakes, and data warehouses, especially in large organizations, can be huge and messy. We've seen organizations with hundreds of tables and schemas with hundreds of columns.
Modern analytics involves materialized views, SQL API endpoints, parameterized query lambdas, and complex data models. LLMs trained on generic SQL examples won't understand your specific architecture. They'll guess and they'll be wrong (but confidently).
What we've learned while building the Tinybird MCP Server
We were among the first to implement an MCP server for our analytics database, literally two days after Anthropic announced the protocol. And recently, we released the remote, hosted Tinybird MCP server for all Tinybird users, which turns a Tinybird workspaces into a set of tools LLMs can reason over.
Since then, we've also built and fine-tuned the Explorations UI, which uses MCP under the hood to solve (or sidestep) many of the problems we mentioned above.
After building thousands of analytical queries with LLMs, here's what we've learned works:
Context is King
To analyze data and answer business questions accurately, without hallucinating, LLMs need context:
- Static context that helps LLMs understand your resources
- Dynamic and semantic context that helps LLMs understand your data
Together, these help LLMs map user intent to your data and produce analytical queries that explain your business.
Giving an LLM a schema is fine when you have two or three well-named tables with a few columns and a simple use case. But it scales badly when you expose the LLM to your entire business and all of its data.
These are, however, some techniques that help LLMs understand your resources.
Document everything as context for the LLM
Materialized views, API endpoints, even the parameters those endpoints accept, should be described in a way that LLMs understand: with text, bullet points, structure (e.g. XML) tags, etc. An overarching set of instructions for each group of resources also helps.
You must instruct the LLM to use those descriptions as context.
When we designed Tinybird pipes and data sources, we added the ability to include a description.
At the time, it was a small QoL improvement for human readers. Now, as agentic use cases surge, it's one of the most important bits of code you can write in Tinybird. Goodbye one-liners, hello comprehensive explanations.
DESCRIPTION >
    The `orders` table contains raw transactional data representing customer purchases.
    Each row corresponds to a single order line item and includes metadata about
    the product, customer, geography, and revenue.

    This table powers all revenue-related analytics across:
    - **Time**: via `timestamp`
    - **Geography**: via `country`
    - **Product dimensions**: via `product_id` and `category`
    - **Customer behavior**: via `customer_id`

    ### Column semantics and behaviors:

    - `order_id`: Unique identifier for each order line. Not necessarily globally unique across customers.
    - `timestamp`: The time when the order occurred. Used for time-series analysis and trend detection.
    - `customer_id`: Internal identifier for the customer. High-cardinality. Used to group behavior or analyze cohorts.
    - `country`: ISO 2-letter country code (e.g., "US", "DE", "ES"). Used for geographic breakdowns.
    - `product_id`: Unique identifier for the product SKU. High-cardinality. Can be linked to a product catalog if available.
    - `category`: Mid-cardinality grouping of products (e.g., "Electronics", "Apparel", "Books"). Good for segmentation and drilldowns.
    - `quantity`: Number of items purchased in the order.
    - `unit_price`: Price per item at the time of purchase.
    - `revenue`: Total amount paid for this line (`unit_price * quantity`). Used for sales aggregation.

    ### Relationships and usage patterns:

    - Each order line is tied to a single product and customer.
    - Common aggregations include: total revenue, order count, avg order value (AOV), revenue per country/category.
    - LLMs should use `timestamp` for any time filtering (e.g., "last week").
    - `revenue` is the key metric for trend analysis, anomaly detection, and business health checks.
    - Can be grouped by `country` or `category` for higher-level insights.
    - Expected to be used with rolling windows, week/month aggregates, and MoM/YoY comparisons.

    ### Notes for LLMs:

    - Use `sum(revenue)` to compute total sales.
    - Use `avg(revenue)` or `sum(revenue)/countDistinct(order_id)` to compute AOV.
    - Combine `country` + `timestamp` to compare revenue across time and region.
    - To detect a drop in revenue, compare recent time slices (e.g. week-over-week or month-over-month).


TOKEN "revenue" APPEND

SCHEMA >
    `order_id` UInt64 `json:$.order_id`,
    `timestamp` DateTime `json:$.timestamp`,
    `customer_id` UInt64 `json:$.customer_id`,
    `country` LowCardinality(String) `json:$.country`,
    `product_id` UInt64 `json:$.product_id`,
    `category` LowCardinality(String) `json:$.category`,
    `quantity` UInt32 `json:$.quantity`,
    `unit_price` Float64 `json:$.unit_price`,
    `revenue` Float64 `json:$.revenue`

ENGINE MergeTree
ENGINE_PARTITION_KEY toYYYYMM(timestamp)
ENGINE_SORTING_KEY (timestamp, country)
ENGINE_TTL timestamp + INTERVAL 12 MONTH
Provide sample data
Big data exhausts context windows. Using data subsets compacts the context while still being sufficiently thorough:
- Run a small query with just a few rows to show the LLM what each table or resource returns.
- Give access to pre-aggregated views that provide access to time series, unique dimension counters, and numeric ranges.
Generate semantic models
Semantic models help LLMs "understand" your data. They explain:
- Facts (numeric values)
- Dimensions (categories and time)
- Metrics (aggregated values)
...and extract data patterns from:
- Sample values
- Time ranges
- Numeric distributions
- Cardinality and uniqueness insights
- Schema metadata and data types
- Example user questions and queries
- Relationships between tables
They can be built dinamyically or you can use an LLM to generate them statically:
## `orders` Datasource

This data source contains revenue-generating transactions from customer purchases. Each row represents a line item in an order and includes time, location, product, and financial details. It is the core table for revenue analytics across time, geography, and product hierarchy.

---

### 1. Schema Overview

- **Engine**: `MergeTree`
  A high-performance table optimized for time-based queries and aggregations.

- **ENGINE_PARTITION_KEY**: `toYYYYMM(timestamp)`
  Used to segment data by month for efficient storage and access.

- **ENGINE_SORTING_KEY**: `(timestamp, country)`
  Enables fast retrieval of time-based and region-based queries.

- **ENGINE_TTL**: `timestamp + INTERVAL 12 MONTH`
  Retains historical data for one year.

- **Columns**:
  - `order_id` (UInt64): Unique identifier per order line. Not globally unique but stable within ingestion.
  - `timestamp` (DateTime): Timestamp of the transaction. Used for temporal filtering and partitioning.
  - `customer_id` (UInt64): Internal customer ID. High cardinality. Enables user-level and cohort analysis.
  - `country` (LowCardinality(String)): Country code (e.g., "US", "FR", "BR"). Medium cardinality.
  - `product_id` (UInt64): Unique product identifier. High cardinality.
  - `category` (LowCardinality(String)): Product grouping such as "Electronics", "Furniture", etc.
  - `quantity` (UInt32): Number of items in the order line.
  - `unit_price` (Float64): Unit price at the time of transaction.
  - `revenue` (Float64): Calculated as `quantity * unit_price`.

---

### 2. Key Columns

#### `timestamp`
- **Type**: `DateTime`
- **Format**: `YYYY-MM-DD HH:MM:SS`
- **Example Values**:
  - `"2025-06-30 14:12:08"`
  - `"2025-07-01 09:45:15"`
- **Notes**: Used for filtering by day, week, month, or rolling windows.

#### `revenue`
- **Type**: `Float64`
- **Range**: 0.00 - 10,000.00+
- **Distribution**: Right-skewed with outliers
- **Usage**: Main fact value for business reporting, KPIs, and trend analysis.

#### `country`
- **Type**: `String`
- **Examples**: `"US"`, `"DE"`, `"BR"`, `"ES"`
- **Cardinality**: ~100
- **Usage**: Geographic filtering, segmentation, and breakdowns.

#### `category`
- **Type**: `String`
- **Examples**: `"Electronics"`, `"Clothing"`, `"Books"`
- **Cardinality**: ~10–30
- **Usage**: High-level product analysis, useful for bar charts and comparisons.

---

### 3. Facts, Dimensions, and Metrics

#### Facts
- `revenue`
- `quantity`
- `unit_price`

#### Dimensions
- `timestamp` (temporal)
- `country` (geographic)
- `category` (product)
- `customer_id` (entity)

#### Metrics
- `SUM(revenue)`: Total sales
- `COUNT(DISTINCT order_id)`: Unique order lines
- `AVG(revenue)`: Average order value (AOV)
- `SUM(quantity)`: Total items sold
- `SUM(revenue) / COUNT(DISTINCT customer_id)`: Revenue per customer
- `SUM(revenue) / COUNT(*)`: Revenue per transaction line

---

### 4. Data Patterns

- **Time range**: Rolling window of 12 months. Mostly active within past 90 days.
- **Seasonality**: Weekly and monthly patterns—sales often spike on weekends or during campaigns.
- **Currency normalization**: Revenue assumed to be in a single currency (e.g., USD).
- **Country bias**: US and EU countries dominate volume.
- **Skew**: 80/20 rule: few categories or customers account for most revenue.
- **Completeness**: All fields are non-null; data is clean and consistently formatted.

---

### 5. Relationships and Join Potential

- Can be joined on `product_id` to a product catalog for metadata (not included here).
- Can be joined on `customer_id` to a customer profile table.
- Often aggregated by `category`, `country`, or `timestamp`.
- Not normalized—revenue is fully materialized for fast querying.

---

### 6. Example Questions the LLM Should Be Able to Answer

- "Why did revenue drop last week in the US?"
- "Which categories contributed most to last month's sales?"
- "What was the average order value for France in June?"
- "How does current revenue compare to the same week last year?"
- "Which customers had the highest spend in Q2?"
- "Was the revenue drop due to fewer orders or lower AOV?"
- "Did any category underperform relative to last month?"

---

### 7. Query Tips for the LLM

- Always filter by `timestamp` with explicit ranges (e.g., `>= now() - INTERVAL 7 DAY`)
- Use `country` = 'US' or any region as a filter when geographic context is needed
- Use `category` for group-by breakdowns
- Pre-aggregate when possible using MATERIALIZED views for week/month summaries
- Use ratio comparisons (`this_week/last_week`) for trend explanations
For a query like "Why did revenue drop last week in the US?", static context and semantic models help the LLM:
- Select the key tables for revenue
- Detect time dimensions to filter "last week"
- Map "US" to a proper dimension
- Find relevant facts and metrics
- Understand relationships, anomalies, and trends
The difference between "Sales are down 15%" and "Sales are down 15%, but that's typical for Tuesdays, and we're actually up 23% from last month" is everything.
Build query loops that learn
Context is necessary, but not enough. LLMs also need data access and auto-fix capabilities.
Instead of hoping for perfect SQL on the first try:
- Validate queries before executing them. Run
LIMIT 1queries to ensure they execute. - Pass errors back to the LLM with context. Use them in a loop so the LLM learns and retries with feedback.
Example:
data = None
attempts = 0
feedback = ""
while attempts < MAX_ATTEMPTS:
    result = llm.generate_sql(schema, prompt, feedback)
    r = requests.get(f"{TINYBIRD_API_URL}/v0/sql?q={result}")
    response = r.json()
    data = response.get("data", [])
    if data:
        break
    error = response.get("error")
    feedback += f"{error}\n"
    attempts += 1

Detailed error messages matter now more than ever.
Also: Instruct your LLM to apply SQL best practices e.g., use sorting keys for filtering, filter before joining, select only the necessary columns, etc. These details matter a lot for performance.
LLM-as-a-judge evaluators
When query generation errors are hard to validate deterministically, use a second LLM:
- Detect syntax issues, invalid functions, or non-existent resources
- Feed that result back to the generator LLM
This loop closes the feedback gap that would otherwise leave agents hanging.
Evaluate the following response taking into account the user prompt and the instructions provided.

Your task in to evaluate the generated response and provide feedback about it.
Only output "PASS" if the response meets all the criteria and if it won't fail when executed against Tinybird.

The output must be in the following format:

‹evaluation>PASS or FAIL</evaluation>
‹feedback>
[What is wrong with the code, and how do you fix it]
‹/feedback>
The real breakthrough
The magic happens when you stop trying to make LLMs perfect at SQL and start making them perfect at understanding your business, its data, and the data analytics infrastructure and tooling you already have in place.
When an LLM knows that your conversion_rate endpoint accepts date ranges and user segments, understands that Tuesday mornings are always slow, and can explain why marketing cares about cohort analysis, that's when you get truly intelligent analytics.
It's not about generating perfect queries.
It's about generating perfect insights.
Where we go from here
The companies that crack agentic analytics won't be the ones with the best LLMs.
They'll be the ones who bridge the gap between human questions, formed in natural language, and the nuances of the data being queried.
That means building systems that:
- Understand your data as well as your analysts do
- Iterate toward correct answers—not just correct syntax
- Provide context, not just calculations
- Scale with your complexity, not despite it
The future of analytics is about making analytical thinking accessible to everyone who needs it. Fast.