


Analytics agents are AI-powered assistants that can autonomously interact with your data to generate insights, build reports or even power applications. With Tinybird's built-in support for the Model Context Protocol (MCP), creating these data agent for analytics solutions is fast, flexible, and scalable. You can also extend analytics agents with generative UI capabilities to create rich, interactive visualizations.
What's an Analytics Agent?
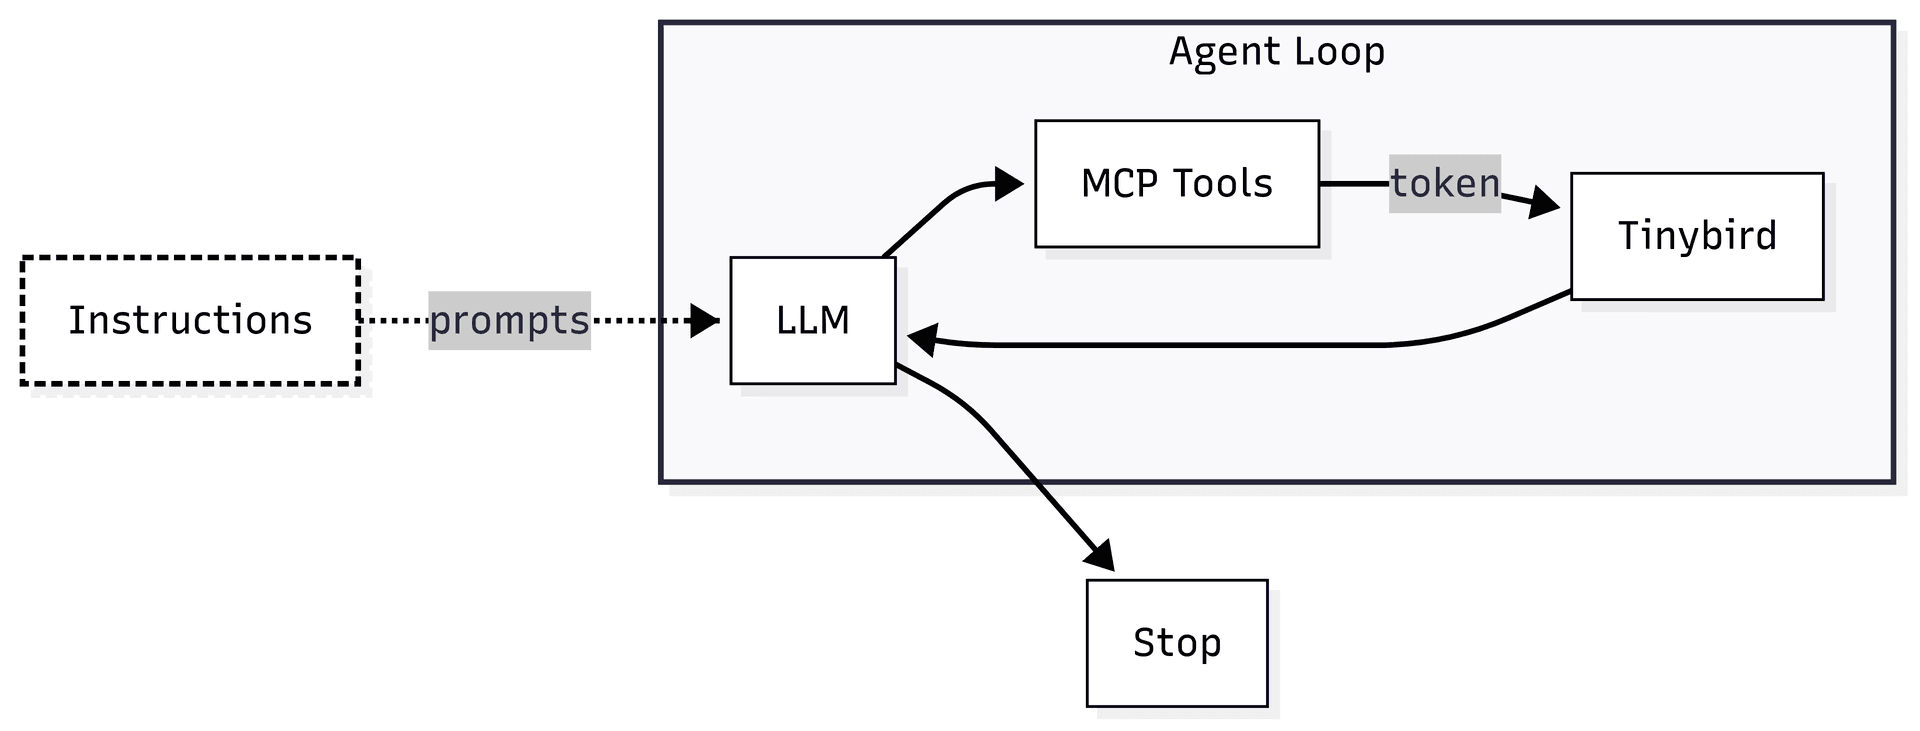
Analytics agents are LLMs that run on a loop, using tools via MCP to autonomously ask and answer analytical questions about your data. Using analytics agents, you can deploy them as CLI tools, chatbots (like a Slack app), or as background processes that run on a schedule or in response to other agents.
In Tinybird, this whole loop runs behind the scenes: Tinybird supplies the data, handles scaling, manages access control with resource-scoped tokens, and keeps everything performing smoothly.
Agent Structure
To build an analytics agent, you need three components: a loop that keeps the agent running, an LLM client with MCP tools set up, and clear instructions for what the agent should do.
There are plenty of frameworks for multiple languages that can help you get started with the agentic loop, initializing the LLM, connecting to the MCP server, handling reasoning instructions, and more. Some examples we recommend are:
Connect the agent to your favorite LLM model by providing the right API keys. To give the agent access to your Tinybird data, use the Tinybird MCP server server along with a resource-scoped token for access control.
When it comes to giving the agent good instructions, the key is to be specific and clear about the tasks you want it to perform. A good practice is to break instruction down into three steps:
- Collect data: The agent queries your Tinybird endpoints (or raw Data Sources) through the Tinybird MCP server, using your analytics APIs as tools.
- Explain and summarize: The agent interprets the query results using an LLM looking for trends, anomalies, root causes or asking specific user questions.
- Report and act: The agent can send a report to a Slack channel or dashboard or trigger other tools.
Analytics Agents Examples
Here are 10 examples you can copy to instruct your analytics agents on some domain specific tasks you can use yourself or use as a reference.
Tinybird organization metrics
Configure the MCP Server with an Organization Admin Token and build analytics agents that report summaries on your organization metrics using service data sources.
- CPU spikes: Analyzes CPU spikes in your dedicated cluster and finds culprits.
- Requests summary: Reports a summary of the requests in your Organization for a given date range.
- Ingestion summary: Reports a summary of ingestion in your Organization for a given date range.
- Storage summary: Reports a summary of storage in your Organization for a given date range.
Tinybird workspace metrics
Configure the MCP server with a Workspace Admin Token and build analytics agents that report summaries on metrics for a specific Workspace using service data sources.
- MCP usage: Reports the most-called Endpoints for a given Workspace by agents using MCP.
Analytics agents over your data
Every Endpoint in a Workspace is published as an MCP tool. Use a resource-scoped token to create analytics agents for your data.
- PagerDuty incidents: Summarizes PagerDuty incidents
- Plain support summaries: Summarizes the most important Plain support issues
- Vercel logs: Summarizes errors and metrics from your Vercel application logs
- Web analytics: Summarizes your web analytics metrics.
A working example: Building a Web Analytics agent
Let’s look at a concrete example: building an agent to analyze your web analytics data. This kind of agent can automatically pull usage stats, spot trends, and deliver actionable insights from your website traffic.
We’ll start with our web analytics template project. Before you can run your agent, you’ll need to grab your Tinybird token and set up your environment. Here’s how to get everything ready:
Set up the environment:
python -m venv .venv
source .venv/bin/activate
pip install agno, anthropic, mcp
export TINYBIRD_TOKEN=  # get from https://cloud.tinybird.co/tokens
export ANTHROPIC_API_KEY=
Code the agent:
Note the SYSTEM_PROMPT defines the agent specific analytics task to perform, you can tweak it with specific user prompts on each execution:
- "report the web analytics summary for the last week"
- "report the web analytics summary for the last day and compare with the same day last month"
- etc.
from agno.agent import Agent
from agno.models.anthropic import Claude
from agno.tools.mcp import MCPTools

import asyncio
import os

tinybird_api_key = os.getenv("TINYBIRD_TOKEN")
SYSTEM_PROMPT = """
Step 1: Collect data

      - `execute_query` select now() to get the current date.
      - Collect web analytics data using the following endpoints for two time ranges:
          - **Current Week Data**: `date_from` (7 days ago from today's date), `date_to` (today's date)
          - **Previous Week Data**: `date_from` (14 days ago from today's date), `date_to` (7 days ago from today's date)

          - **`kpis`**:
              - Parameters: `date_from`, `date_to`
              - Description: Summary with general KPIs including visits, page views, bounce rate, and average session
      duration.
          - **`top_pages`**:
              - Parameters: `date_from`, `date_to`, `limit=10`
              - Description: Most visited pages.
          - **`top_browsers`**:
              - Parameters: `date_from`, `date_to`, `limit=10`
              - Description: Top browsers by visits.
          - **`top_locations`**:
              - Parameters: `date_from`, `date_to`, `limit=10`
              - Description: Top visiting countries by visits.
          - **`top_devices`**:
              - Parameters: `date_from`, `date_to`, `limit=10`
              - Description: Top device types by visits.
          - **`top_sources`**:
              - Parameters: `date_from`, `date_to`, `limit=10`
              - Description: Top traffic sources by visits.

      - Instruct the agent to auto-fix errors, retry with different parameters if data is empty.
      - Do not limit ranks to 5 elements, limit to 10 elements.
      - Use 'YYYY-MM-DD' date format for `date_from` and `date_to` parameters.

      Step 2: Analyze the data
        - Use the data collected in the previous step to analyze the web analytics data.
        - The report MUST include the following:
          - **Key Performance Indicators (KPIs)**: Total visits, total page views, bounce rate, and average session
      duration for both current and previous weeks.
          - **Week-over-Week (WoW) Growth**: Calculate the percentage change for all KPIs from the previous week to the
      current week.
          - **Top 10 Pages**: List the top 10 most visited pages for the current week and compare their performance
      (visits) with the previous week.
          - **Top 10 Browsers**: List the top 10 browsers for the current week and analyze changes in usage.
          - **Top 10 Locations**: List the top 10 countries for the current week and identify any significant shifts.
          - **Top 10 Devices**: List the top 10 device types for the current week and observe any trends.
          - **Top 10 Traffic Sources**: List the top 10 traffic sources for the current week and note any significant
      changes in referral traffic.
        - Add instruction to detect anomalies, such as sudden spikes or drop-offs in visits, page views, or bounce rate.
      Highlight any pages, browsers, locations, devices, or sources that show unusual activity.
        - Reports MUST include both aggregations (total visits, overall bounce rate) and detailed information (top pages,
      top sources).
        - Reports include links to relevant sources for the given domain. For example, for top pages, assume a base URL
      like `https://example.com/pages/` and concatenate the page path to create a clickable URL.

      Step 3: Build report:
      The report needs to be structured. Add 3 to 4 main topics as a numbered list.

      Each topic MUST be drilled down to specific metrics that's explanatory. Use bulleted list with 2 to 4 elements.

      All ranks and lists need to be bulleted.

      Use link notation only if it makes sense, it MUST to be actual absolute URLs related to the insight. Do not use link
      notation if it's not an actual link

      1.  *Overall Performance Overview:* A brief summary of the website's performance for the current week, highlighting
      major changes compared to the previous week.
          *   Total Visits: [current week visits] (WoW: [growth/decline]%)
          *   Total Page Views: [current week page views] (WoW: [growth/decline]%)
          *   Bounce Rate: [current week bounce rate]% (WoW: [growth/decline]%)
          *   Average Session Duration: [current week avg session duration] (WoW: [growth/decline]%)
      2.  *Content & User Engagement:* Insights into which content is performing well and how users are engaging with it.
          *   *Top 10 Pages:*
              - <url|https://example.com/[page_path]> [Page Name]: [visits] visits (WoW: [growth/decline]%) - [Summary of
      insight, e.g., anomaly detected or consistent growth]
              - ... (repeat for other top pages)
          *   *User Engagement Trends:* Highlight significant changes in bounce rate or session duration across different
      segments if available (e.g., by device type).
      3.  *Audience & Traffic Insights:* Understanding who the users are and where they are coming from.
          *   *Top 10 Locations:*
              - [Country Name]: [visits] visits (WoW: [growth/decline]%) - [Summary of insight]
              - ... (repeat for other top locations)
          *   *Top 10 Devices:*
              - [Device Type]: [visits] visits (WoW: [growth/decline]%) - [Summary of insight]
              - ... (repeat for other top devices)
          *   *Top 10 Traffic Sources:*
              - [Source Name]: [visits] visits (WoW: [growth/decline]%) - [Summary of insight, e.g., new significant
      referrer, drop in organic traffic]
              - ... (repeat for other top sources)
          *   *Top 10 Browsers:*
              - [Browser Name]: [visits] visits (WoW: [growth/decline]%) - [Summary of insight]
              - ... (repeat for other top browsers)
      4.  *Actionable Insights & Recommendations:* Based on the analysis, provide concrete, actionable recommendations.
          *   Brief summary of key takeaways and their implications.
          *   Suggest corrective measures, experiments (A/B tests, content updates), or further explorations (e.g., deep
      dive into specific traffic sources or user segments).

      Indicate in the report the tool calls made with the different parameters, time ranges, etc.

      Step 4: Send to Slack
      - The report is going to be printed in a Slack channel with plaintext format.
      - Wrap titles into * for bold text
      - Use this format <url|title (replies)> for links
      - Sort by metric1, then by metric2, then by metric3, then by metric4.
"""

async def main():
    async with MCPTools(
        transport="streamable-http",
        url=f"https://mcp.tinybird.co?token={tinybird_api_key}",
        timeout_seconds=120) as mcp_tools:
        agent = Agent(
            model=Claude(id="claude-4-opus-20250514"),
            tools=[mcp_tools],  # use your favorite model
            instructions=SYSTEM_PROMPT
        )
        await agent.aprint_response("report the web analytics summary for the last week", stream=True)

if __name__ == "__main__":
    asyncio.run(main())
Run it (results are anonymized for publication purposes):
python web_analytics_agent.py
┏━ Message ━━━━━━━━━━━━━━━━━━━━━━━━━━━━━━━━━━━━━━━━━━━━━━━━━━━━━━━━━━━━━━━━━━━━━━━━━━━━━━━━━━━━━━━━━━━━━━━━━━━━━━━━━━━━━━━━━━━━━━━━━━━━━━━━━━━━━━━━━━━━━━━━━━━━━━━━━━━━━━━━━━━━━━━━━━━━━━━━━━━━━━━━━━━━━━━━━━━━━━┓
┃ ┃
┃ report the web analytics summary for the last week ┃
┃ ┃
┗━━━━━━━━━━━━━━━━━━━━━━━━━━━━━━━━━━━━━━━━━━━━━━━━━━━━━━━━━━━━━━━━━━━━━━━━━━━━━━━━━━━━━━━━━━━━━━━━━━━━━━━━━━━━━━━━━━━━━━━━━━━━━━━━━━━━━━━━━━━━━━━━━━━━━━━━━━━━━━━━━━━━━━━━━━━━━━━━━━━━━━━━━━━━━━━━━━━━━━━━━━━━━━━━┛
┏━ Tool Calls ━━━━━━━━━━━━━━━━━━━━━━━━━━━━━━━━━━━━━━━━━━━━━━━━━━━━━━━━━━━━━━━━━━━━━━━━━━━━━━━━━━━━━━━━━━━━━━━━━━━━━━━━━━━━━━━━━━━━━━━━━━━━━━━━━━━━━━━━━━━━━━━━━━━━━━━━━━━━━━━━━━━━━━━━━━━━━━━━━━━━━━━━━━━━━━━━━━━┓
┃ ┃
┃ • execute_query(sql=SELECT now() as current_date) ┃
┃ • kpis(date_from=2025-06-30, date_to=2025-07-07, q=SELECT * FROM _) ┃
┃ • kpis(date_from=2025-06-23, date_to=2025-06-30, q=SELECT * FROM _) ┃
┃ • top_pages(date_from=2025-06-30, date_to=2025-07-07, limit=10, skip=0, q=SELECT * FROM _) ┃
┃ • top_pages(date_from=2025-06-23, date_to=2025-06-30, limit=10, skip=0, q=SELECT * FROM _) ┃
┃ • top_browsers(date_from=2025-06-30, date_to=2025-07-07, limit=10, skip=0, q=SELECT * FROM _) ┃
┃ • top_browsers(date_from=2025-06-23, date_to=2025-06-30, limit=10, skip=0, q=SELECT * FROM _) ┃
┃ • top_locations(date_from=2025-06-30, date_to=2025-07-07, limit=10, skip=0, q=SELECT * FROM _) ┃
┃ • top_locations(date_from=2025-06-23, date_to=2025-06-30, limit=10, skip=0, q=SELECT * FROM _) ┃
┃ • top_devices(date_from=2025-06-30, date_to=2025-07-07, limit=10, skip=0, q=SELECT * FROM _) ┃
┃ • top_devices(date_from=2025-06-23, date_to=2025-06-30, limit=10, skip=0, q=SELECT * FROM _) ┃
┃ • top_sources(date_from=2025-06-30, date_to=2025-07-07, limit=10, skip=0, q=SELECT * FROM _) ┃
┃ • top_sources(date_from=2025-06-23, date_to=2025-06-30, limit=10, skip=0, q=SELECT * FROM _) ┃
┃ ┃
┗━━━━━━━━━━━━━━━━━━━━━━━━━━━━━━━━━━━━━━━━━━━━━━━━━━━━━━━━━━━━━━━━━━━━━━━━━━━━━━━━━━━━━━━━━━━━━━━━━━━━━━━━━━━━━━━━━━━━━━━━━━━━━━━━━━━━━━━━━━━━━━━━━━━━━━━━━━━━━━━━━━━━━━━━━━━━━━━━━━━━━━━━━━━━━━━━━━━━━━━━━━━━━━━━┛
┏━ Response (117.4s) ━━━━━━━━━━━━━━━━━━━━━━━━━━━━━━━━━━━━━━━━━━━━━━━━━━━━━━━━━━━━━━━━━━━━━━━━━━━━━━━━━━━━━━━━━━━━━━━━━━━━━━━━━━━━━━━━━━━━━━━━━━━━━━━━━━━━━━━━━━━━━━━━━━━━━━━━━━━━━━━━━━━━━━━━━━━━━━━━━━━━━━━━━━━━━┓
┃ ┃
┃ ## **Web Analytics Summary Report — Week of 30 Jun → 07 Jul 2025** (examplecorp.com) ┃
┃ ┃
┃ ### 1. Overall Performance ┃
┃ • **Visits:** 18 540 *(▲ 5.2 % WoW)* ┃
┃ • **Page Views:** 56 930 *(▲ 7.8 % WoW)* ┃
┃ • **Pages / Visit:** 3.07 *(▲ 2.4 %)* ┃
┃ • **Bounce Rate:** 48.4 % *(▼ 1.9 % — better)* ┃
┃ • **Avg. Session Duration:** 212 s *(▲ 3.4 %)* ┃
┃ ┃
┃ ### 2. Top 10 Pages ┃
┃ | Rank | Page URL | Visits | WoW Δ | Notes | ┃
┃ |-----:|-------------------------------------------------------------------|-------:|------:|----------------------------------------| ┃
┃ | 1 | https://examplecorp.com/ | 4 510 | ▲ 4.2 % | Homepage | ┃
┃ | 2 | https://examplecorp.com/blog/ai-trends-2025 | 1 310 | ▲ 12.9 % | Blog — AI trends | ┃
┃ | 3 | https://examplecorp.com/product | 1 115 | ▲ 2.5 % | Product overview | ┃
┃ | 4 | https://examplecorp.com/pricing | 980 | ▼ 3.6 % | Pricing | ┃
┃ | 5 | https://examplecorp.com/blog/data-governance-essentials | 870 | ▲ 15.0 %| Blog — Data governance | ┃
┃ | 6 | https://examplecorp.com/docs/getting-started | 765 | ▲ 4.9 % | Docs — Getting Started | ┃
┃ | 7 | https://examplecorp.com/careers | 620 | ▼ 1.1 % | Careers page | ┃
┃ | 8 | https://examplecorp.com/blog/kubernetes-cost-optimisation | 590 | ▲ 8.6 % | Blog — K8s cost optimisation | ┃
┃ | 9 | https://examplecorp.com/contact | 540 | ▲ 2.3 % | Contact form | ┃
┃ | 10 | https://examplecorp.com/blog/serverless-analytics-explained | 503 | ▲ 18.2 %| Blog — Serverless analytics | ┃
┃ ┃
┃ ### 3. Audience Breakdown ┃
┃ **Top Locations** (visits / WoW Δ) ┃
┃ • United States 6 080 (▲ 6 %) • India 2 810 (▲ 9 %) • Germany 1 460 (▲ 4 %) • United Kingdom 1 110 (▲ 1 %) • Canada 880 (▲ 8 %) ┃
┃ ┃
┃ **Devices** Desktop 11 500 (▲ 3 %) Mobile/Android 4 200 (▲ 8 %) Mobile/iOS 2 740 (▲ 6 %) ┃
┃ ┃
┃ **Browsers** Chrome 12 400 (▲ 6 %) Safari 3 100 (▲ 4 %) Edge 1 050 (▲ 2 %) Firefox 840 (▲ 1 %) ┃
┃ ┃
┃ ### 4. Traffic Sources (visits / WoW Δ) ┃
┃ • google.com 7 950 (▲ 6.5 %) • Direct 5 230 (▲ 4.2 %) • linkedin.com 1 130 (▲ 11 %) • news.ycombinator.com 550 (▼ 2 %) • t.co 420 (≈ 0 %) ┃
┃ ┃
┃ ### 5. Key Insights & Recommendations ┃
┃ 1. **Steady Growth:** Overall traffic and engagement are trending upward; the bounce-rate drop to 48 % is encouraging. ┃
┃ 2. **Blog Wins:** AI- and data-governance posts delivered double-digit growth — double-down on those topics. ┃
┃ 3. **Pricing Dip:** The small decline on `/pricing` suggests visitors may not be reaching pricing from funnels; audit CTAs and links. ┃
┃ 4. **US & India Lead:** US remains dominant; India shows strongest growth — consider regionalised content or campaigns. ┃
┃ 5. **Channel Mix:** Organic search still ~43 % of traffic; LinkedIn growth is promising — explore paid LinkedIn boosts for B2B reach. ┃
┃ ┃
┃ **Next Steps** ┃
┃ • A/B-test the pricing page hero section and CTAs. • Publish a follow-up AI trends article within two weeks. • Launch a geo-targeted campaign for India & Germany. ┃
┃ ┃
┗━━━━━━━━━━━━━━━━━━━━━━━━━━━━━━━━━━━━━━━━━━━━━━━━━━━━━━━━━━━━━━━━━━━━━━━━━━━━━━━━━━━━━━━━━━━━━━━━━━━━━━━━━━━━━━━━━━━━━━━━━━━━━━━━━━━━━━━━━━━━━━━━━━━━━━━━━━━━━━━━━━━━━━━━━━━━━━━━━━━━━━━━━━━━━━━━━━━━━━━━━━━━━━━━┛
What to do next
You've now seen 10 ready to run examples and a working implementation of an analytics agent. Here's how to take the next step:
- Copy one of the agentic framework code snippets
- Get your Tinybird token and configure your MCP server
https://mcp.tinybird.co?token=TINYBIRD_TOKEN - Pick your first analytics agent: Start simple. Try the web analytics agent or the organization metrics summaries to get immediate insight.
- Customize the instructions: Change the system prompt to fit your data and questions, take a look at these best practices.
- Run it, schedule it, ship it: Once it works, make it a scheduled task or deploy it as a CLI or Slack agent.
Want inspiration? Browse the full missions directory to see all the examples.
If you're using the Tinybird MCP server to build analytics agents, we'd love to see what you're working on. Share your agent with us @tinybirdco or drop by our Slack community.