Mar 25, 2021

Visualize your Data Sources and Pipes dependencies on Tinybird

A better way to visualize the relationships between your Data Sources, Pipes and Materialized Views.
Tinybird
Team

We’ve just released the Data lineage graph, a new feature that will let you visualize how the Data Sources, Pipes and Materialized Views on a workspace are connected. It will help you know where the data comes from, and where it’s going to, in a visual way.

The Data Lineage graph

There are two ways to use it:

  • Clicking on the Data lineage graph button in the top of the left sidebar.
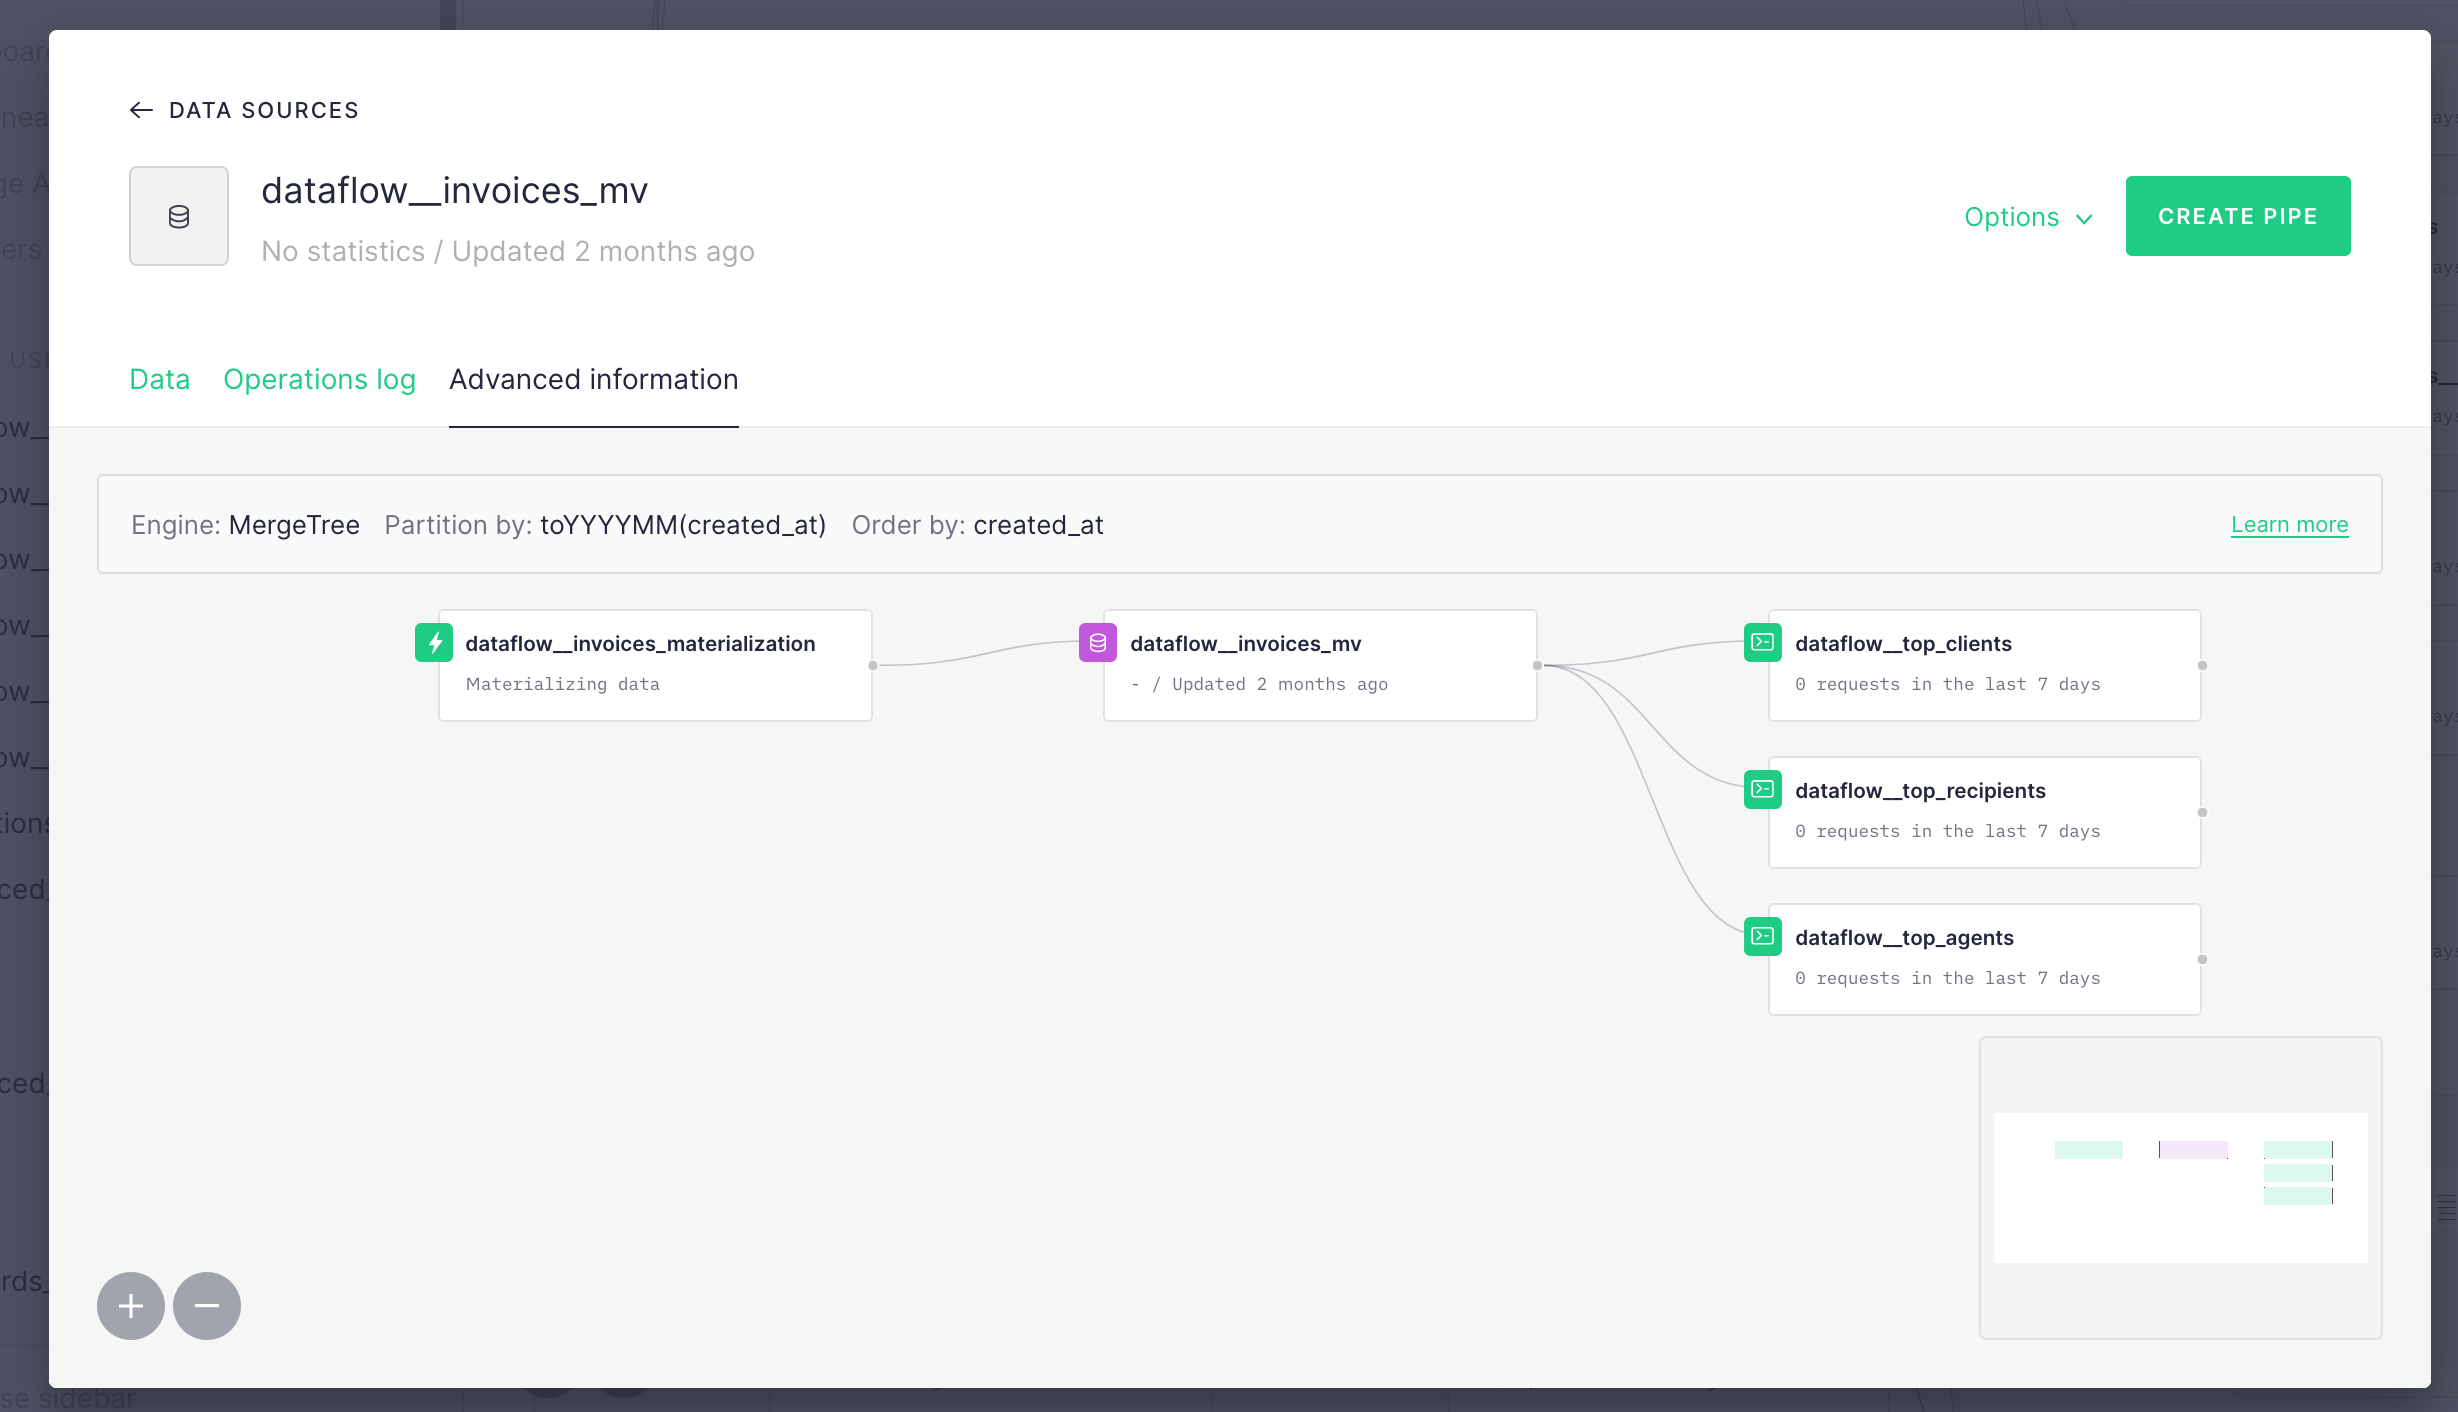
  • Clicking on the Advanced information tab of a Data Source modal
Data Sources also have a Data lineage graph on their details modal

We see some potential benefits for this feature:

  • Better and simpler onboarding of new team members into big data projects.
  • More visibility into which Data Sources are being unused
  • More visibility of Pipes without an active endpoint

The Data Sources and Pipes will have different colors, to better help you understand what’s going on. These are consistent across all the UI. Data Sources’ icons are purple if they’re being used by any pipe, and red if they’re not. Pipes’ icons are green if they expose an endpoint, or orange if the don’t. And Materialized Views have green icons, with a ⚡️ inside.

We’re excited to see if this is a feature that makes sense to you, our users. We’ve built it to be able to solve the problems we found when dealing with large data projects. We already see a lot of avenues to improve it but we’d love to get your feedback.

Do you like this post?

Related posts

Tinybird Changelog: New User Experience for Data Exploration
Introducing a redesigned Tinybird UI for better developer productivity
Tiny Updates: Drag and Drop to Rearrange Nodes in a Pipe
Changelog #15: improved data flow graph, anomaly detection and more

Tinybird

Team

Jun 25, 2021
Announcing Tinybird Charts: Fast Real-Time Charts, Even Faster

Tinybird

Team

Jun 12, 2024
Real-time Data Visualization: How to build faster dashboards
Using Tinybird for real-time marketing at Tinybird
How to monitor Tinybird using Datadog with vector.dev
Chatting GraphQL with Jamie Barton of Grafbase

Tinybird

Team

Apr 24, 2023
Simplifying event sourcing with scheduled data snapshots in Tinybird

Build fast data products, faster.

Try Tinybird and bring your data sources together and enable engineers to build with data in minutes. No credit card required, free to get started.
Need more? Contact sales for Enterprise support.