What if I told you I could save you $40,000 a day? Would you think I’m crazy?
$40,000 may be an astronomical number, but with what some companies are spending on cloud data warehouse egress costs, the order of magnitude perhaps isn’t so far out of the realm of reality.
Regardless of the dollar amount you assign to the problem, the point is this: if you don’t take care to craft your data pipelines, you’re going to overspend. $40K a day is extreme, but bad data management has a cost. A chorus of data engineers and data practitioners including people like Chad Sanderson and Lauren Balik remind us of this almost daily.
How you build analytical queries - and specifically how you manage the amount of data that they process to get the answers you want - can have a huge impact on your cloud bill. It’s critically important that you have robust observability measures to alert you to requests consuming excess data - and the “tax” you’re paying to run them.
At Tinybird we always say to work backwards. Build a functional endpoint, then work hard and fast to optimize it so it processes as little data as possible when it’s queried in production.
So here is a real - albeit extreme - example of putting that to work, and how it impacts costs.
If video is more your thing, you can watch my talk on this subject right below:
The data
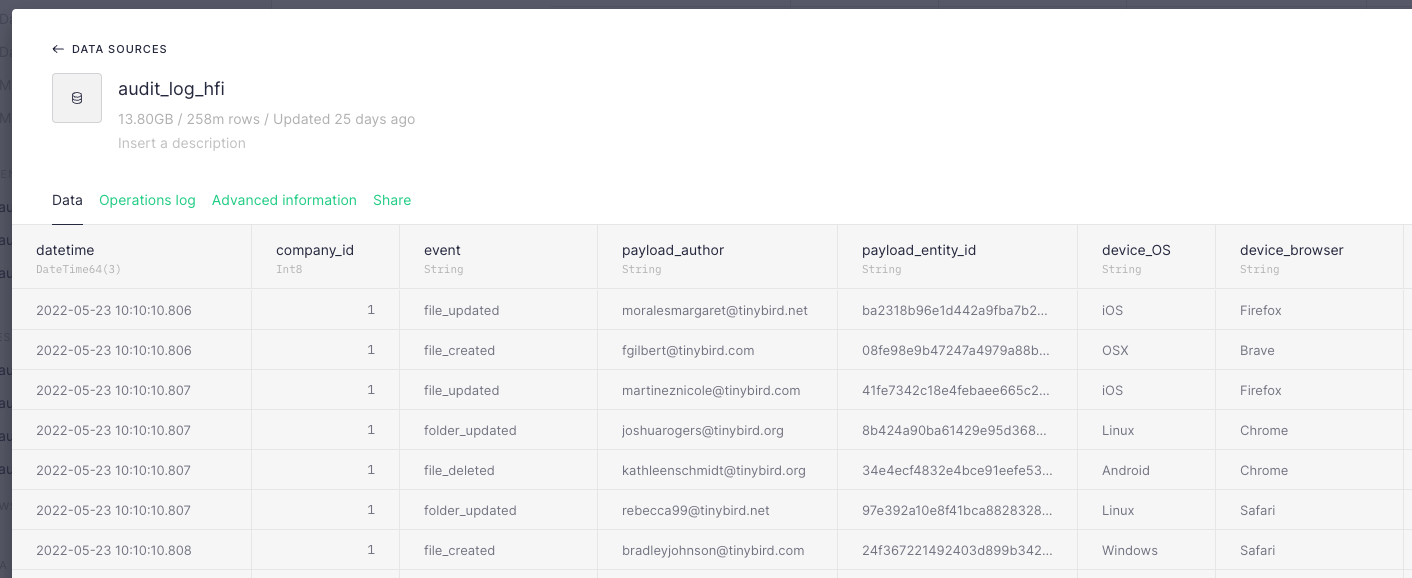
Consider an example data source: An audit log containing 258M rows and nearly 14 GB of product usage data sorted and indexed by a company_id. This is a very realistic data set: If my product had 10,000 daily active users generating 100 events per day, I’d easily hit that size in less than a year.
I want to know how many events of a particular type occurred during a particular time period, grouped by country. Seems pretty simple, right?
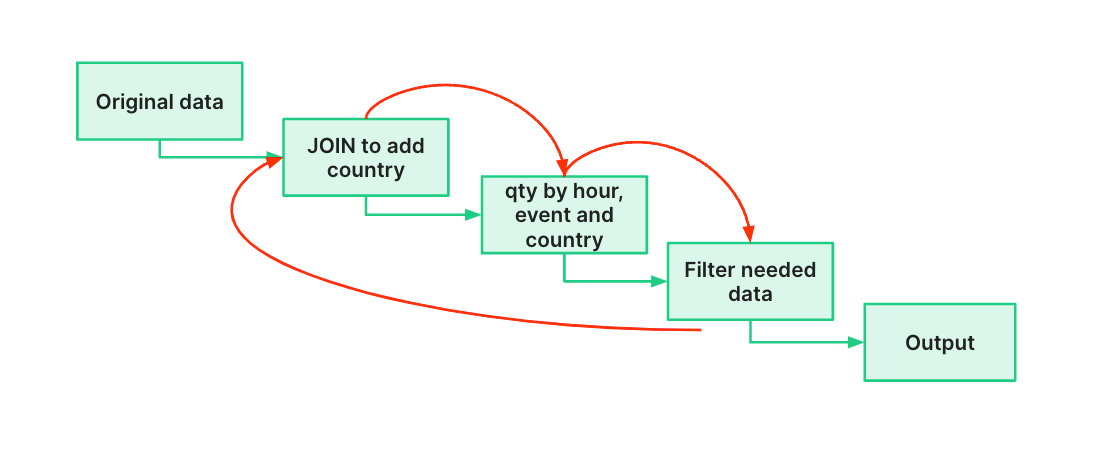
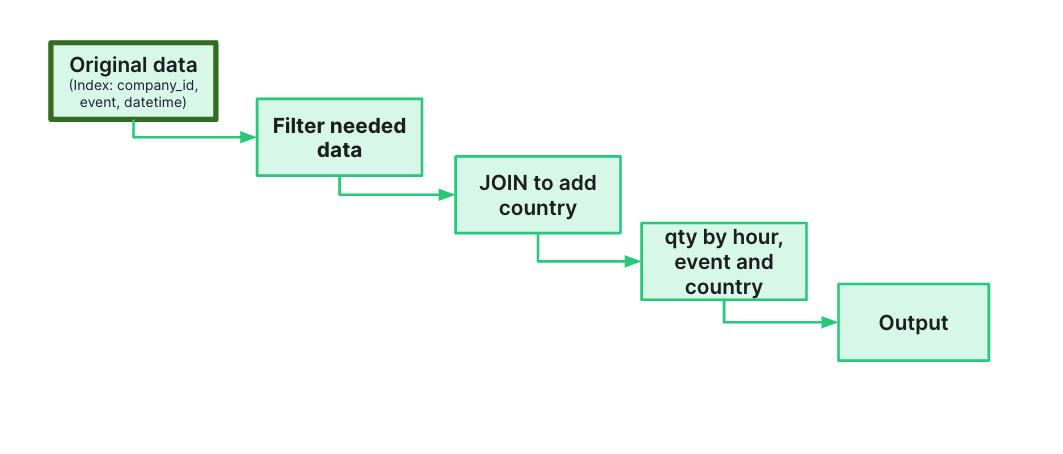
Here’s a diagram of how I might go about that:

I start with the events data, join it to a table containing country data on an author_id, aggregate, then filter to the timestamps and event types I want. Easy peasy, and here’s how that looks in a Tinybird Pipe (a chain of nodes containing iterative SQL queries):
But hold on a minute. If you took the time to read through those queries, or if you’re a savvy data engineer, you probably already spotted the problems. This approach is really inefficient. In fact, this query scans 6.67 GB every time it’s called and takes 2.41 s to complete. Yikes.
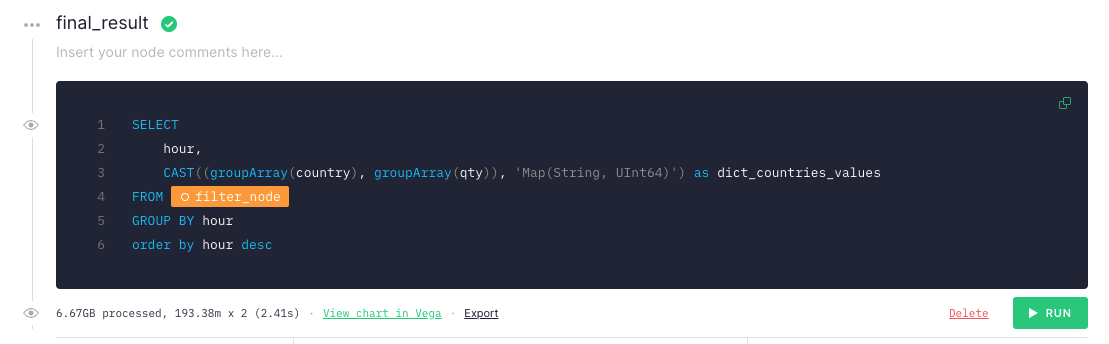
If I built an application to visualize this result and refreshed it every second, I would spend $40,340.16/day on Tinybird’s Pro-plan. 😳
How do we fix it?
Whether you’re a data engineer or not, there are some fundamental rules you can follow to not only spend significantly less but also improve the performance of your queries. We’ve described them in detail in one of our guides, and I’ll list them here:
- Rule № 1 ⟶ The best data is the data you don’t write.
- Rule № 2 ⟶ The second best data is the data you don’t read.
- Rule № 3 ⟶ Sequential reads are 100x faster.
- Rule № 4 ⟶ The less data you process after reading, the better.
- Rule № 5 ⟶ Do complex operations later in the processing pipeline.
My original query breaks all five of these rules. Whoops. So here’s how I fixed it:
Filter first, join later
The first and simplest fix is to apply filters first and do the join later. By doing so, I speed up my query by following rule 1. Instead of writing a massive join to memory, I’m filtering first, so that subsequent results are smaller.
While that speed boost should deliver a better frontend UX, I still have a problem: The amount of data I read to complete the query hasn’t changed. I’m still spending roughly the equivalent of a 2021 Tesla Model Y every day.
What to do? Let’s take a look at the schema.
Indices and data types
If you peek at the schema, you’ll see a few problems.
First, I’m using expensive String data types where a LowCardinality(String) is more appropriate, because columns like event, device_OS, and device_browser have only a limited number of options. We can grab back some memory just by assigning appropriate data types.
Second, my sorting keys are incomplete based on the filters I’m trying to apply.
Because I’m filtering on event and datetime columns, I should add them to the sorting keys.
By making these changes to the schema of my data source, I’m following rules 2 and 3: Reading less data - and sequential data - to filter, since now my filters are applied to indexed columns.
Just making these simple changes has massive implications on cost, because now instead of reading every row in the table, the query can target the granules in the table that fit within my event and datetime filters.
The resulting query now reads only 76 MB in less than 400 ms, I’ve cut costs by 100X to just $400 a day, and I’ve given the frontend UX a nice boost with a much lower response latency.
Materialized views: the ace up our sleeve
So I’ve just saved $39,600 and it’d be easy to call it a day. But there’s one more thing I can do to squeeze as much as I can out of this query.
In Tinybird, materialized views can easily be created using Pipes. Instead of terminating a Pipe in an API endpoint, you can materialize the results, and reap the benefits later. Materialized views update on ingestion in Tinybird, so they’re always up to date.
The best part? There’s no processing cost to incrementally update the materialized views, and the storage cost is negligible (in this case less than one-thousandth of a cent).
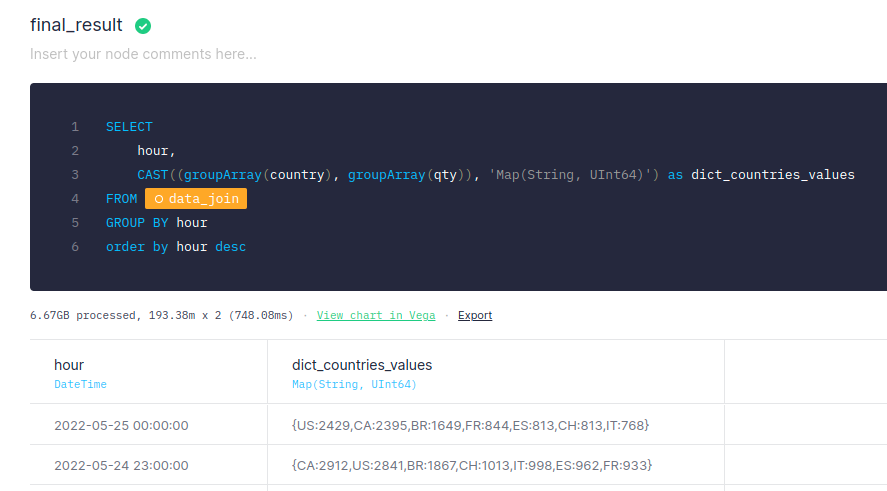
To improve query performance even more, I’ll materialize the join and aggregation first. Instead of calling the result below through an API endpoint, I materialize it into a new data source called join_data_mv.
Now, I can query that materialized view instead of the original data source:
The final result scans only 333 kB in about 1 ms.

I got the same result as my first query, but with a blazing fast frontend and a bill of just $18/day.
Obviously, compared to the reduction that I got in our third optimization, from $40K to $400, this might seem like only an incremental gain. But this isn’t just about what I saved on this query. It’s about what I’ll save on this query and every query I build after it. By implementing simple best practices, and using materialized views, I can not only justify my value as a data practitioner but also have a real shot at generating a meaningful ROI from this analysis.
Do this enough, and maybe your company will just go ahead and buy you a Tesla to say thanks.