


GitHub repo: https://github.com/tinybirdco/datadog-integration/
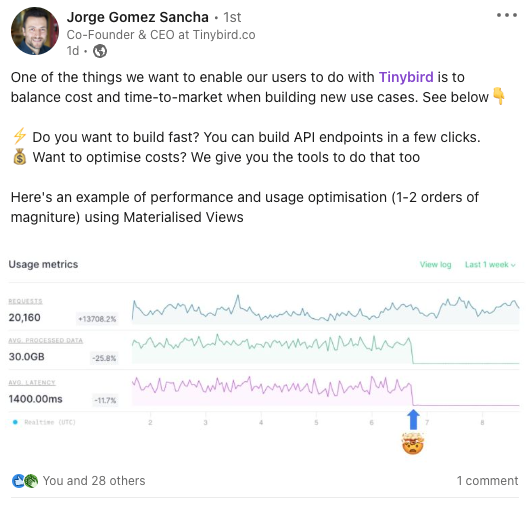
You may have seen that we recently made some upgrades to our observability capabilities in Tinybird. Specifically, we added some new columns to our pipe_stats and pipe_stat_rt Service Data Sources, plus we added a usage graph to the API endpoint pages in our UI to track the most common metrics, namely request count, average processed data, error rate, and average latency.
This is a great boost for better observability in our UI, and we’re happy to have released it. But still, some of our customers have asked for a bit more flexibility in their observability visuals. Specifically, a handful wanted to get Tinybird usage stats into Datadog, where they’re already tracking observability stats across their stack. Our pipe_stats_rt Data Source is pretty rich, and there’s way more data you can get out of those tables than we show natively in our UI.
We’re constantly exploring new ways to improve observability both within and outside of Tinybird (keep your eyes peeled!), but our customers need this now.
So, I did what every good Customer Success engineer does: I built it for them using free tools and Tinybird. This blog explains how I used vector.dev to get Tinybird usage data into Datadog so our customers who use Datadog could track performance under one roof.
What is vector.dev?
If you haven’t heard of it, vector.dev is a lightweight tool built by Datadog that lets you build observability pipelines really quickly. It helps you easily read from one or more observability data sources and easily forward it on to other destinations. It’s built in Rust, is super fast, and works great for realtime use cases. Naturally, it’s a great fit at Tinybird.
What’s in the repo?
This project has 3 sets of files:
- A Tinybird data project
These files define two Tinybird API endpoints, one to serve Data Source operations metrics fromdatasources_ops_logand one to serve endpoint usage metrics frompipe_stat_rt, plus a Data Source to keep track of the last execution to avoid duplicating data in Datadog. In addition, the files define a token with READ access to the endpoints and APPEND access to the Data Source. - Vector.dev files
These files define the data sinks, sources, and transforms that connect data received from Tinybird API endpoint requests to Datadog. - GitHub Actions file
This file is a simple scheduler that runs a cron job every 10 minutes which makes the requests from the Tinybird API and pushes data into Datadog.
How does it work?
I love how beautifully simple this project was, in all respects. First of all, creating endpoints in Tinybird is super easy. You just connect a Data Source (in this case the Data Sources are built-in Service Data Sources), transform them with SQL Pipes, and publish an endpoint in a click. It literally takes a few minutes.
Example Tinybird code
As an example, here’s the Tinybird code to create the ep_data_pipes_stats endpoint with key observability metrics from all the Pipes in my Tinybird Workspace for the time between the last entry in Datadog and now.
You can see how I’m creating a READ access token, defining the node as an endpoint, and transforming the data with SQL. Pushing this code to Tinybird automatically creates a new API endpoint (plus the docs!) that I can then use in my vector.dev workflows.
The vector.dev files
In my vector.dev files (example), I defined my input, sinks, and transforms to appropriately route data from Tinybird to Datadog. As my source, I used stdin, since I’m passing the results from the Tinybird request directly to the vector.dev workflow using a bash pipe.
The 3 sinks send data to Datadog (for visualizing the metrics), to the Tinybird Data Source that keeps track of the last event sent to Datadog, and to console (so I can see that something is happening).
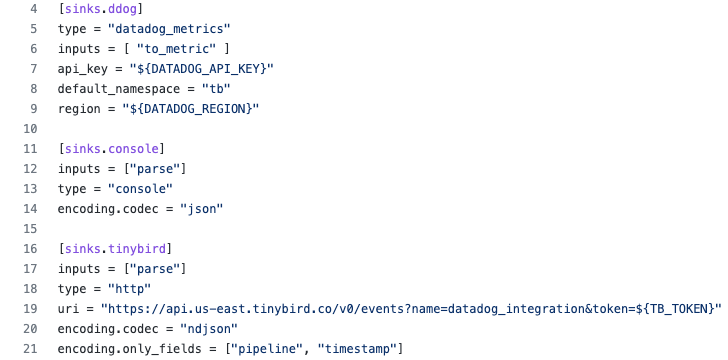
Above, I’m passing the necessary environment variables for Datadog and Tinybird, and in the case of the Tinybird sink sending only the pipeline and timestamp fields, since I just need to keep track of the last event sent to Datadog, not all the details.
And finally, I defined some transforms in vector.dev that essentially just tell Datadog how to visualize the data I’m sending it.
GitHub Actions file
I created a GitHub Actions .yml file that defines the schedule and actions to request data from my Tinybird endpoints and pass it to the vector.dev workflows. Of course, I could have used any scheduler, but GitHub Actions made it easy and simple.
Basically this file just creates a simple job (“datadog”) that runs, for each Tinybird endpoint, a handful of steps culminating in a script that requests data from the endpoint and passes it to the vector.dev workflows on stdin using a bash pipe.
The GitHub Actions file also lets me define the environment variables I’ll need to pass including the Datadog API key, region, and the Tinybird token.
For more info on using GitHub Actions, you can check out their docs here.
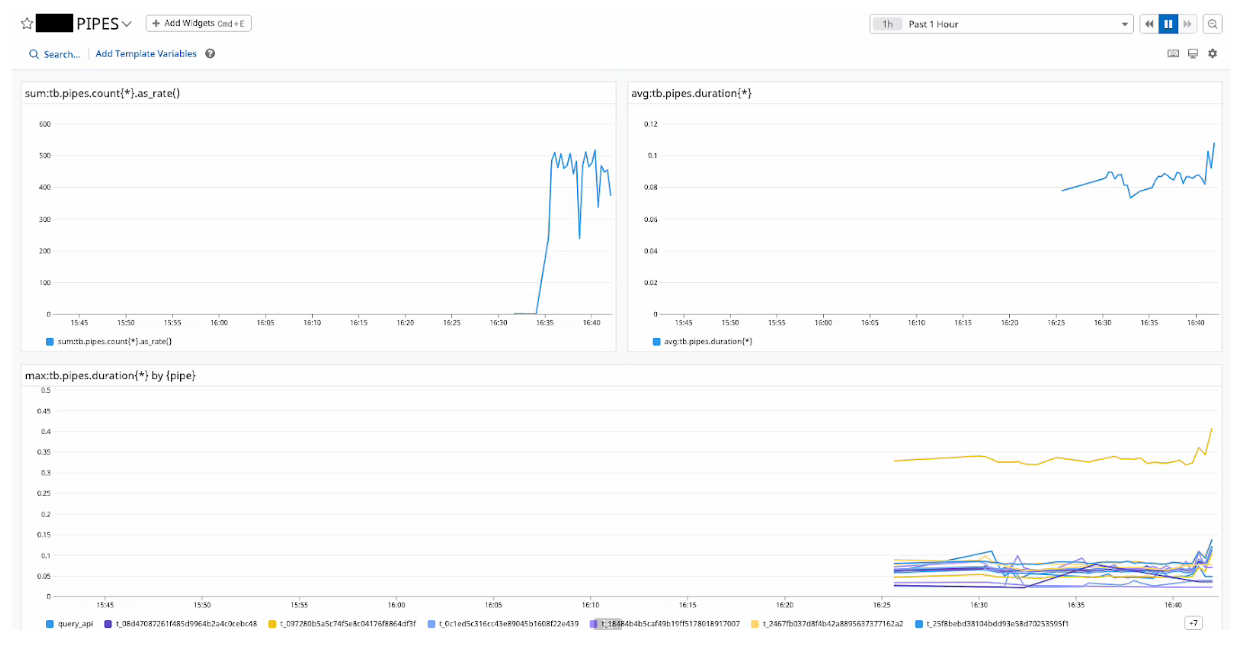
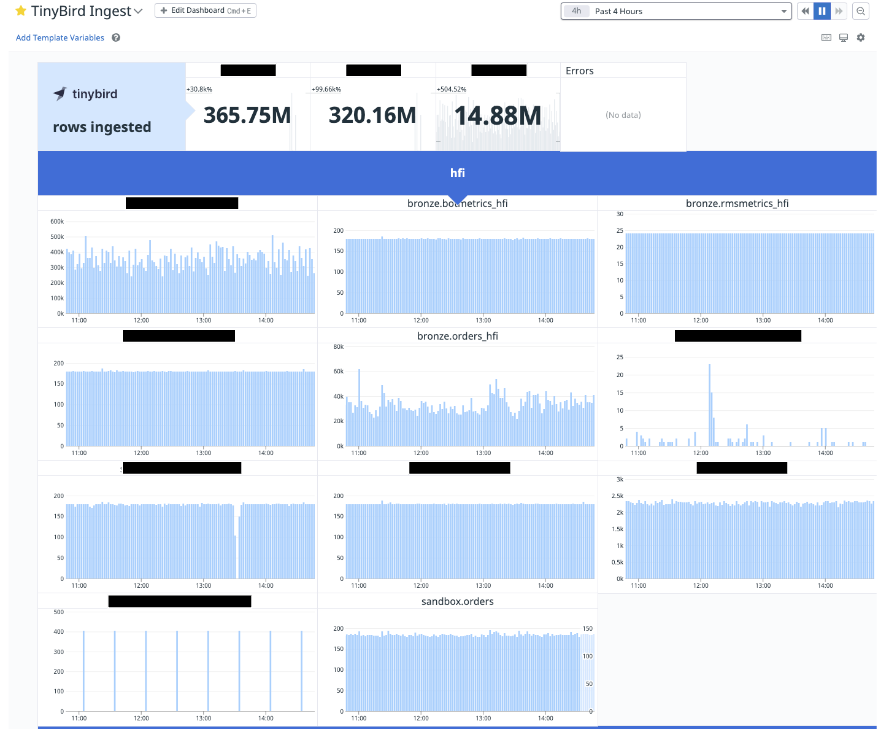
Putting it to use
I’ve been able to share this repo with several of our customers, and it’s running great. I’ve taken a couple of screenshots below to show how two different customers have put it to use in their own ways.
It’s always fun to deliver something valuable to our customers on top of what they already have with us, and it’s often amazing how quickly we can get it done with Tinybird. Of course, that’s what we’re going for: speed and simplicity. In this case, it worked out exactly that way!
I never thought that what started as a side project with vector.dev would have such a big impact with our customers, but this aligns perfectly with our product development approach. When our customers come to us with something that is not “possible” - in this case we didn’t natively support a Datadog integration - our first step is to just try to make it possible. I was familiar with vector.dev and was able to make this possible in a couple hours, and now we get to see how they use it, learn, and then take steps to make it first comfortable, then delightful.
Observability is a big priority for us at Tinybird. It makes me super happy to iteratively improve and be able to share it here. If you have any questions about this use case, feel free to hop on our community Slack and DM me!