


Alerts based on simple statistics are valuable; in a recent blog post, we explored the use of the z-score statistic based on the context of the last n minutes of time-series data to alert when a data value was anomalous. However, you may want to use a more complex model to predict control limits. For example, if you have a long run of time-series data from which you can extract seasonality and trend then there is value in using a Python library that contains time-series models, such as Prophet or statsmodels. There is no need to code the model from scratch, you can simply fit your model and generate predictions on another platform and then use those predictions in Tinybird for your alerts. Thereby leveraging the power of pre-coded or even pre-trained models to predict realtime data.
The workflow is:
- extract your time-series from the Data Source
- fit your model to the time series
- generate predictions from the fitted model
- create a Data Source of the predictions
- alert when a data value is beyond the predicted control limits using an API Endpoint
Let’s walk through an example using Prophet on two years of historic New York taxi trip data (2018 and 2019) to predict the next month’s data (January 2020) and generate alerts. Full details are in in this Google Colab notebook.
Step 1: SQL query to extract the time-series
Query the Data Source using the CLI from within a notebook to generate the time series. The ‘taxi’ Data Source contains the New York City Taxi & Limousine Commission Yellow Taxi Trip data for 2018 and 2019, some 187 M records.
Load the time series of the number of events each day into a pandas DataFrame
Step 2: Fit your model
Model the time-series data by fitting the Prophet model in python.
Step 3: Generate predictions
Generate predictions from the fitted model.
Plot the historic data and the predictions for the next month, and the components of the fitted time-series model: trend, daily, weekly and yearly.
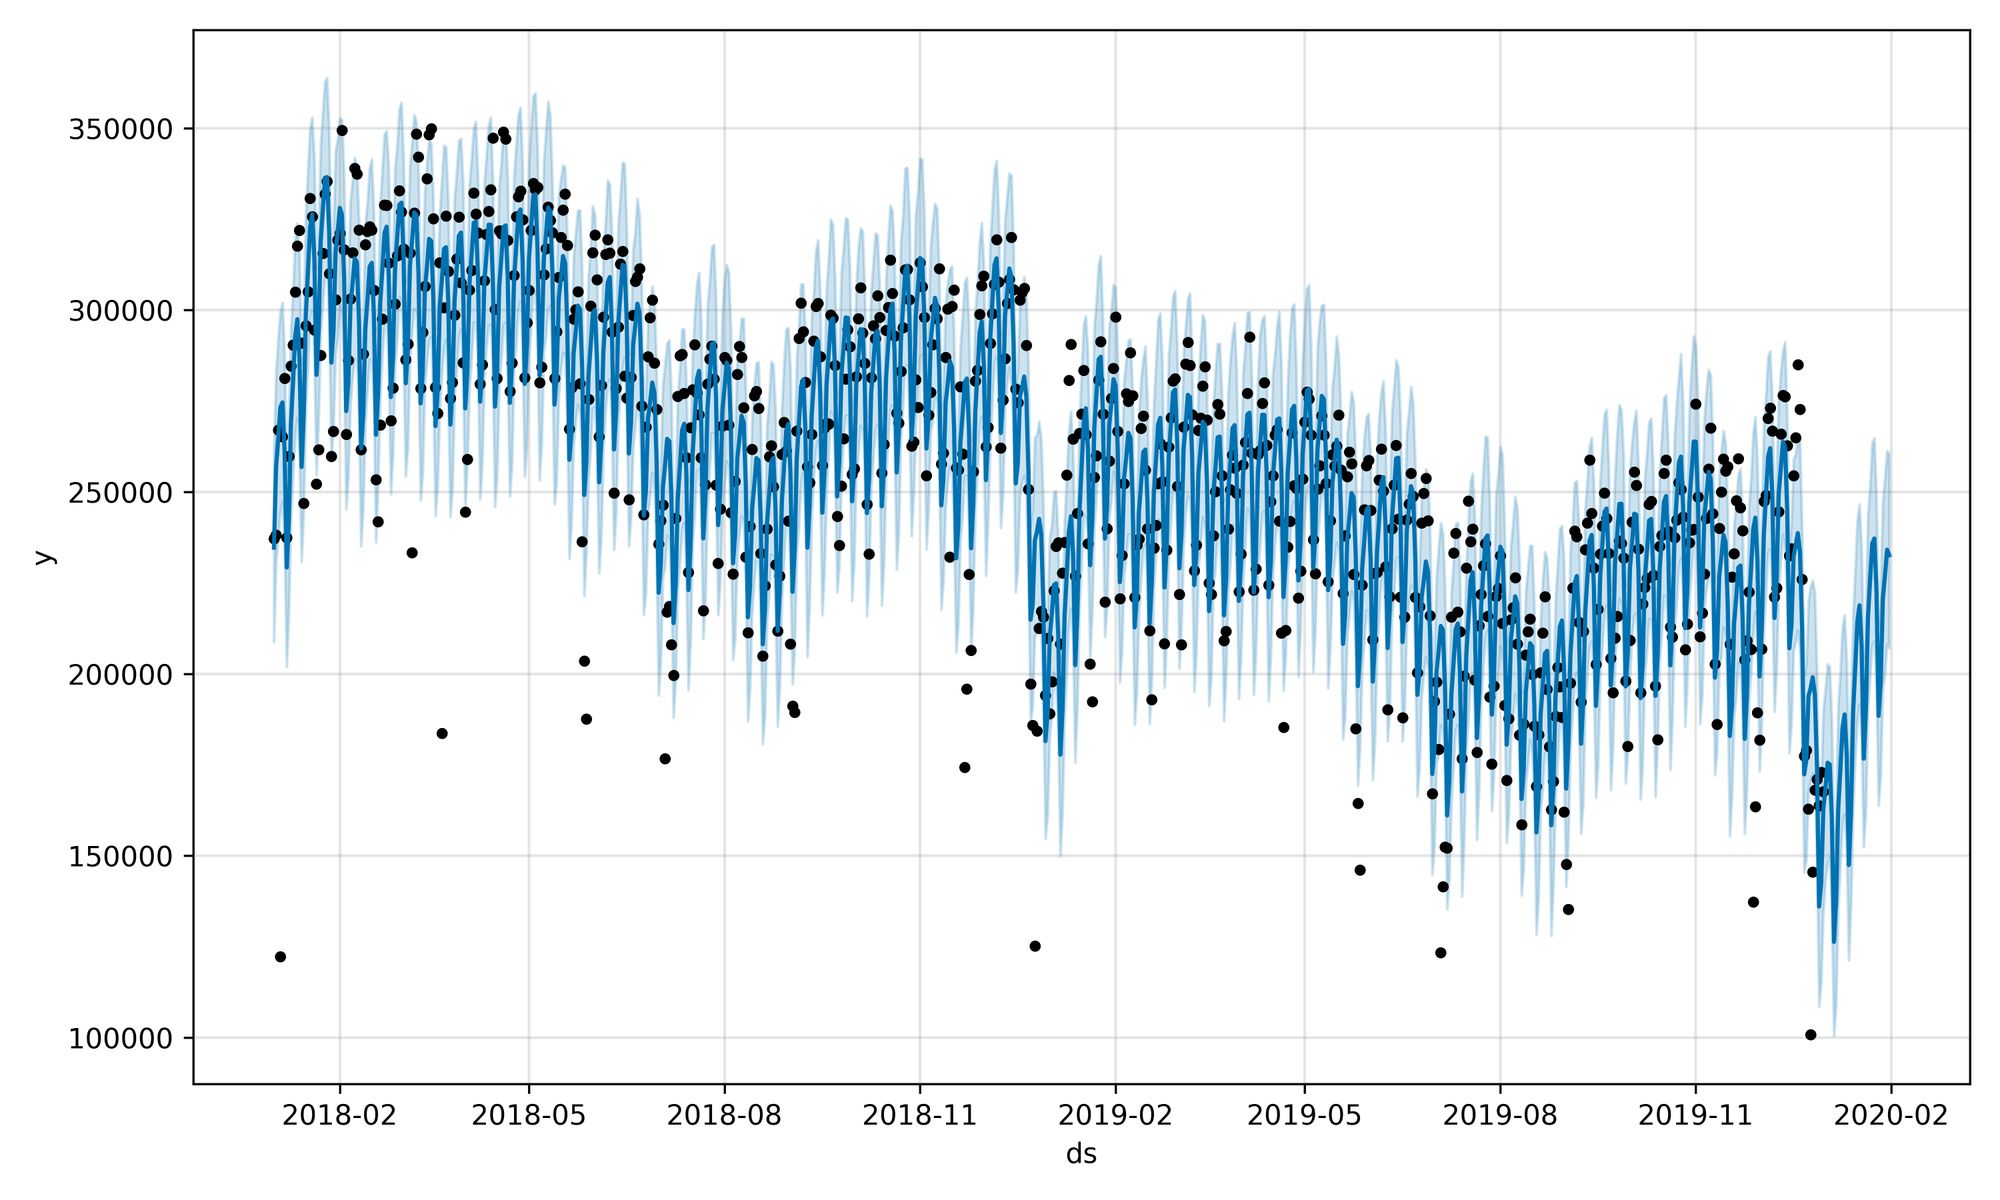
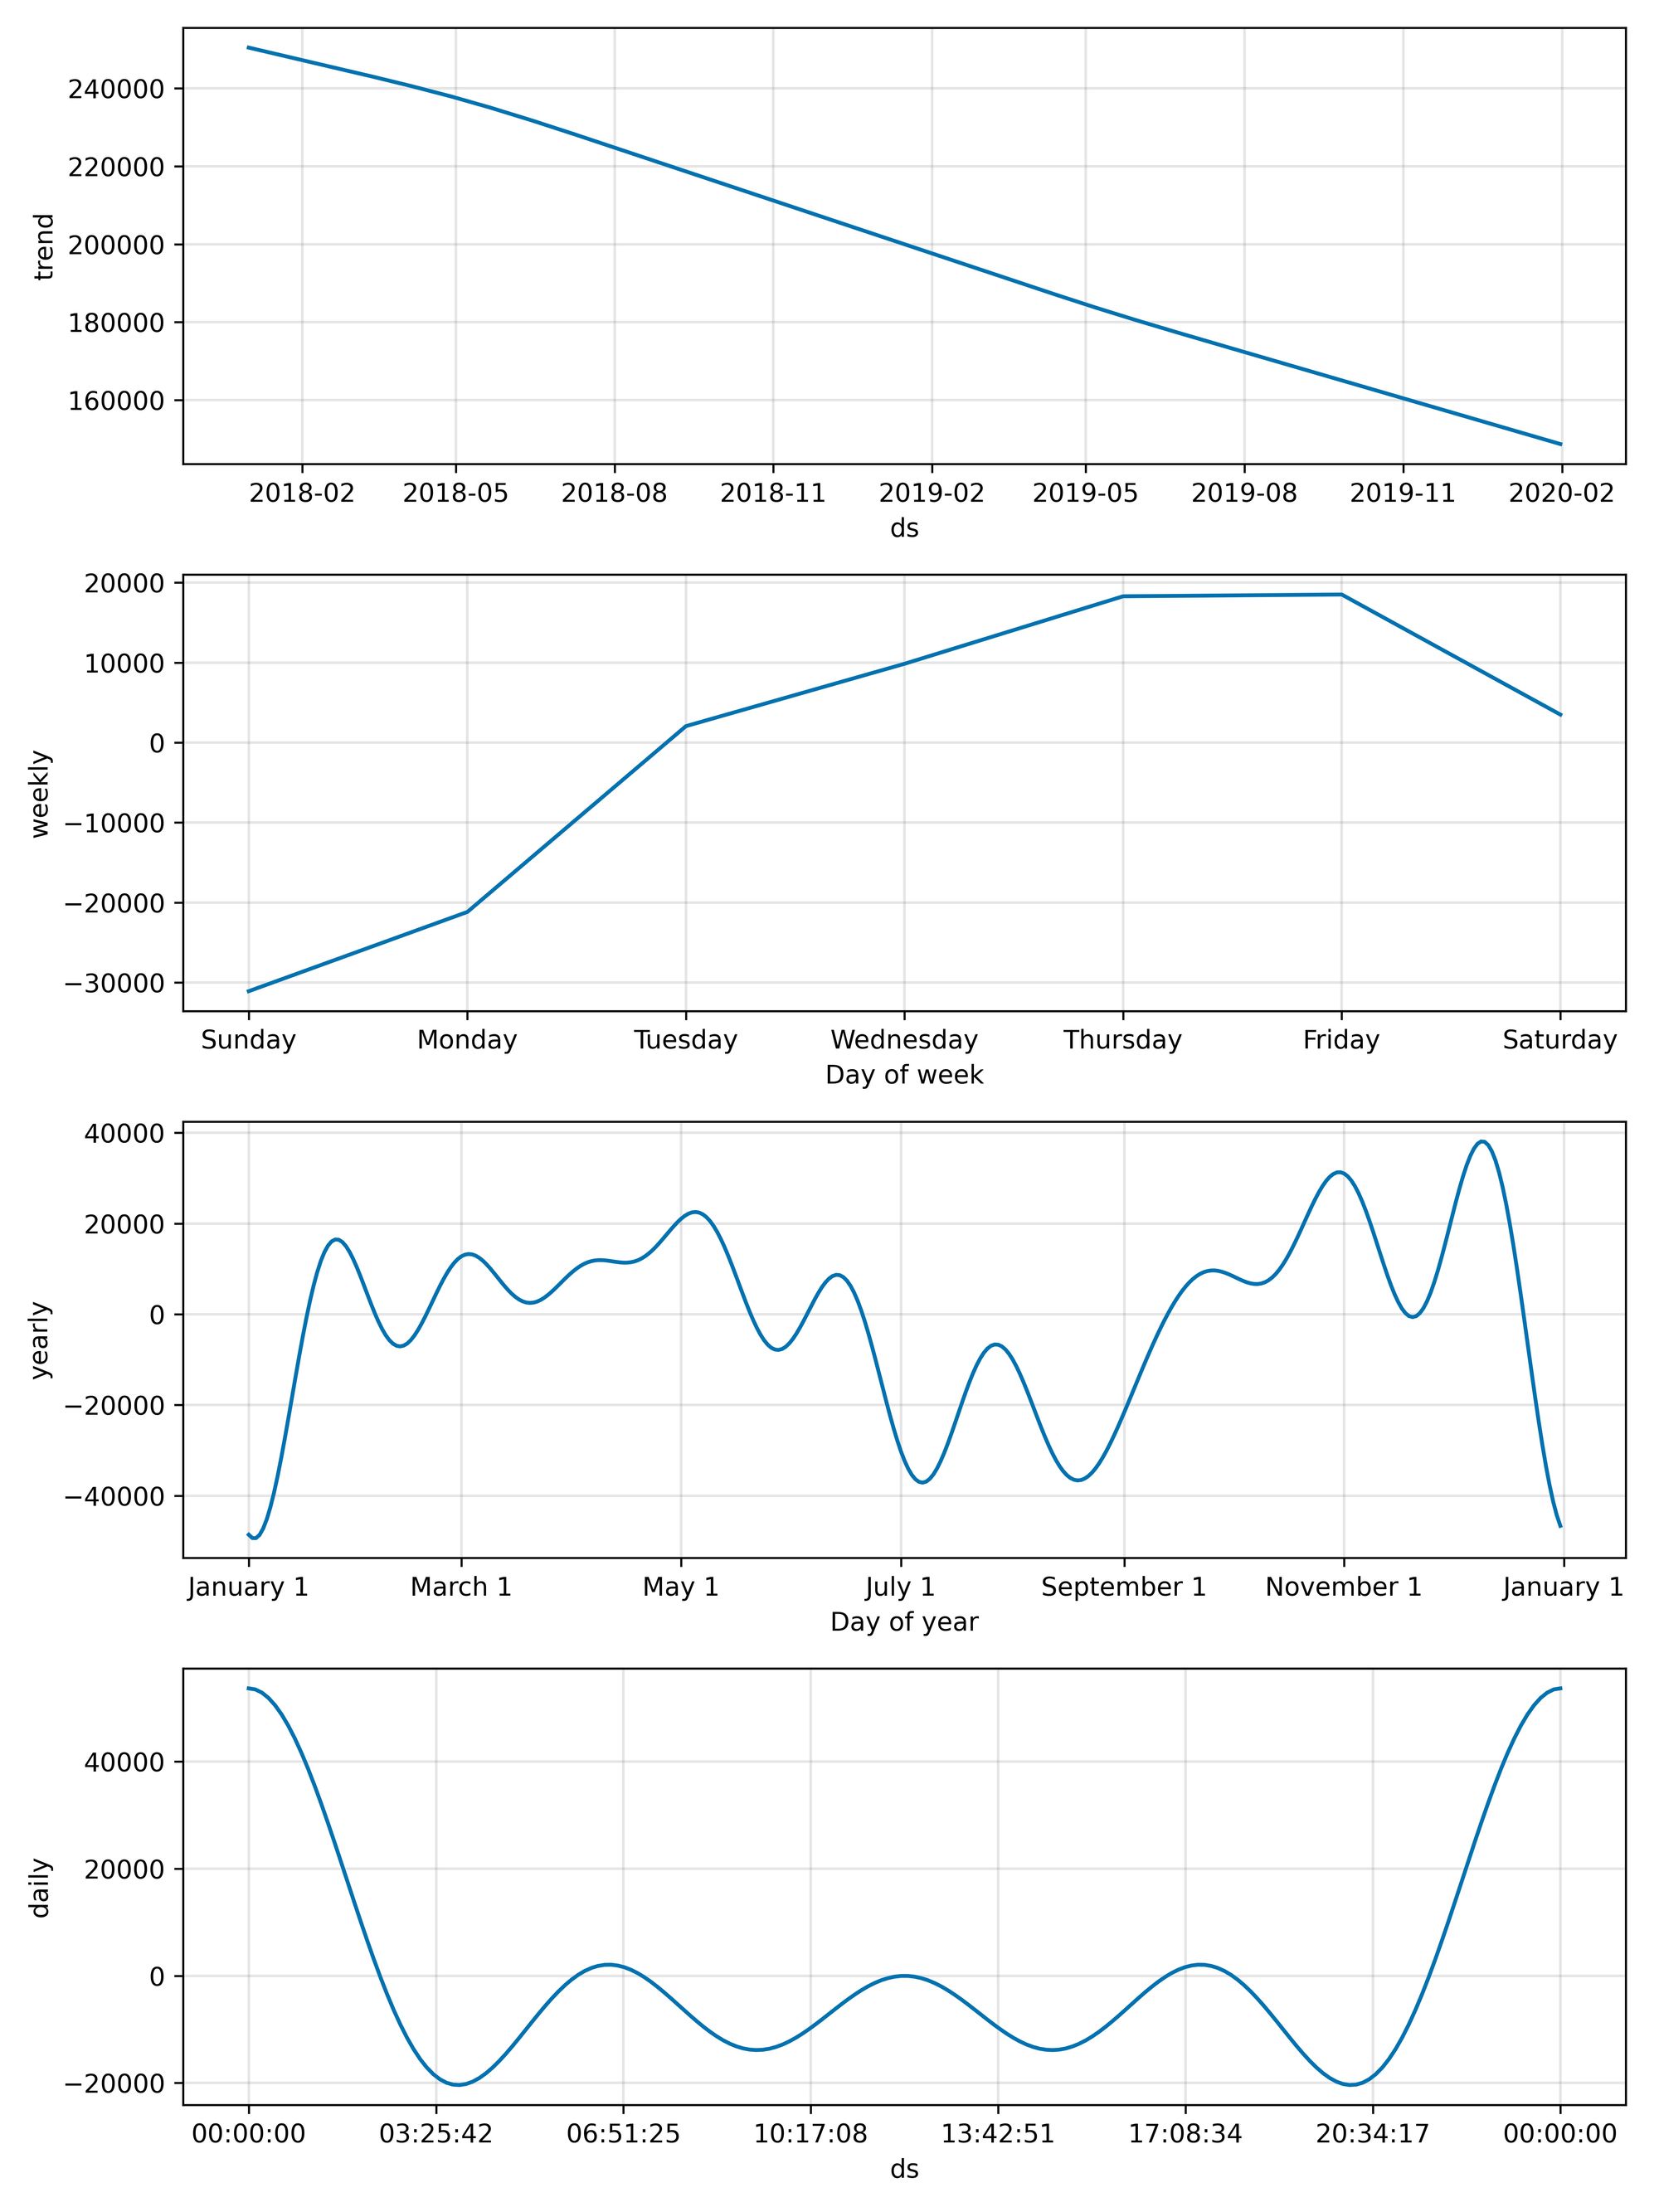
The trend in the number of daily yellow taxi trips is clearly descending, with peak activity on Thursdays and Fridays, fewer trips in the summer and most trips at night.
Step 4: Data Source of predictions
Write the predictions to a Tinybird Data Source.
Step 5: Alerts Pipe and API Endpoint
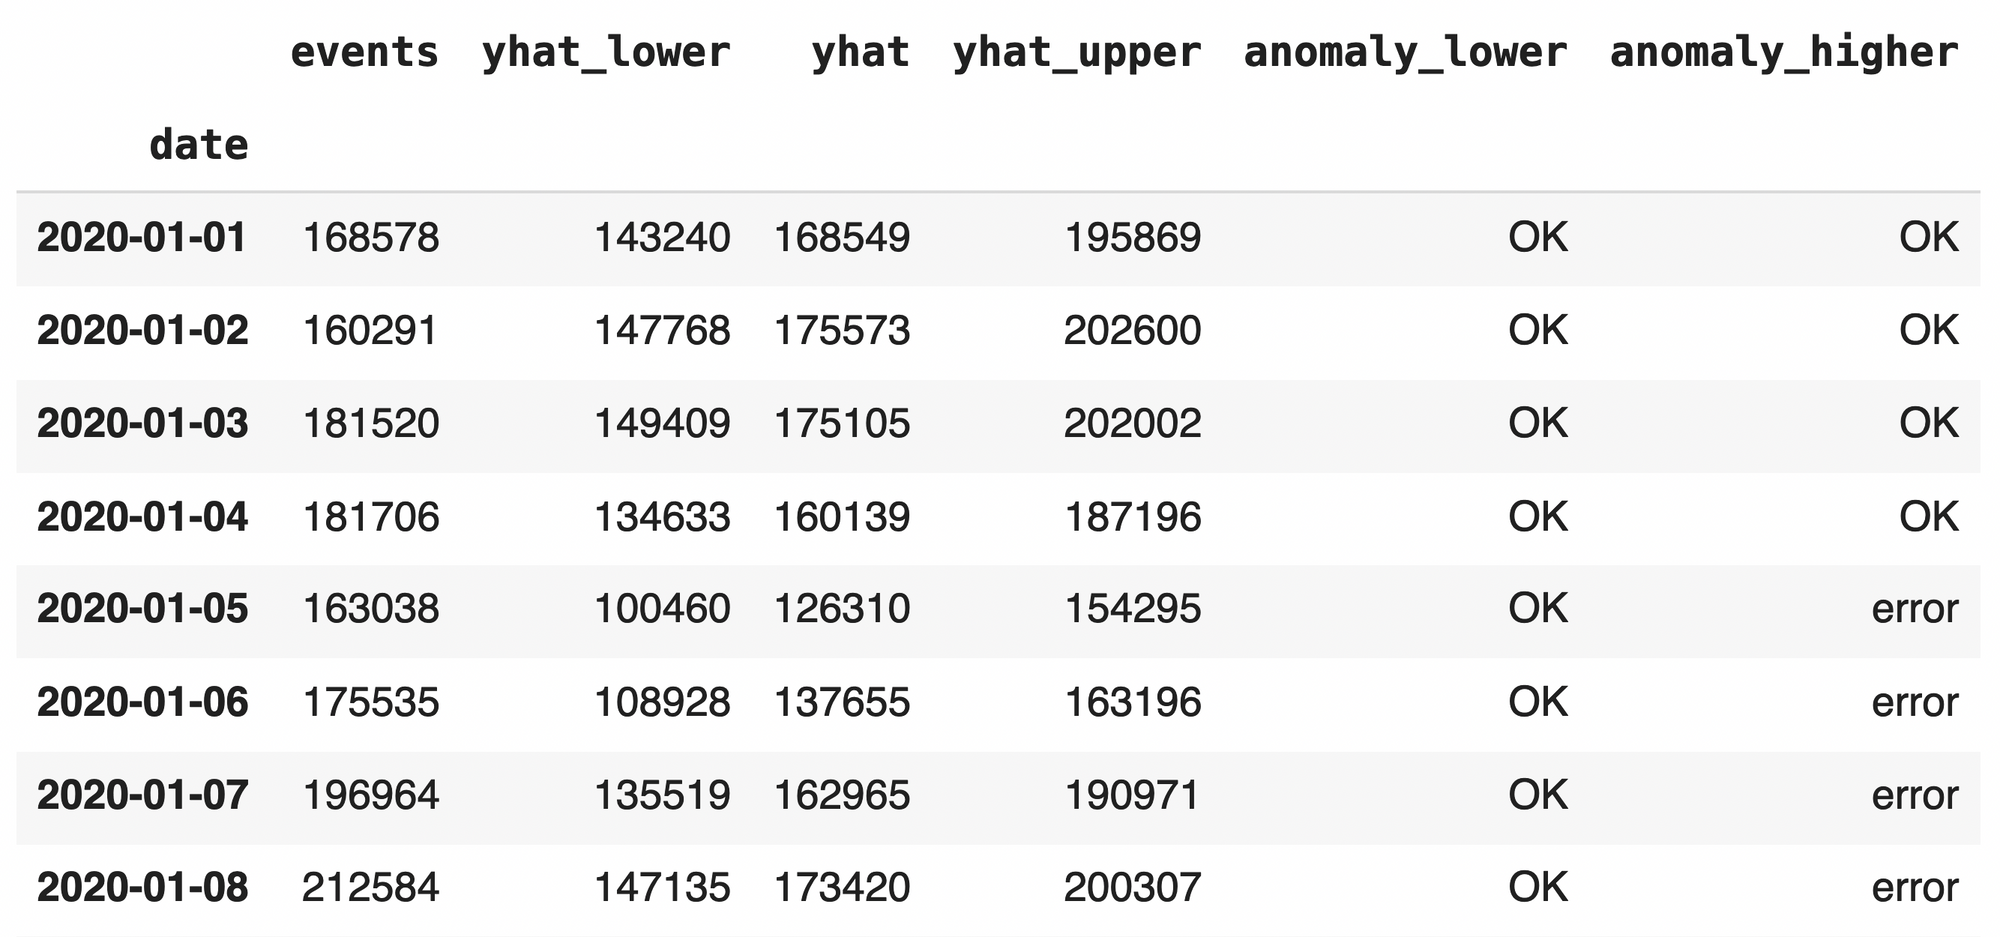
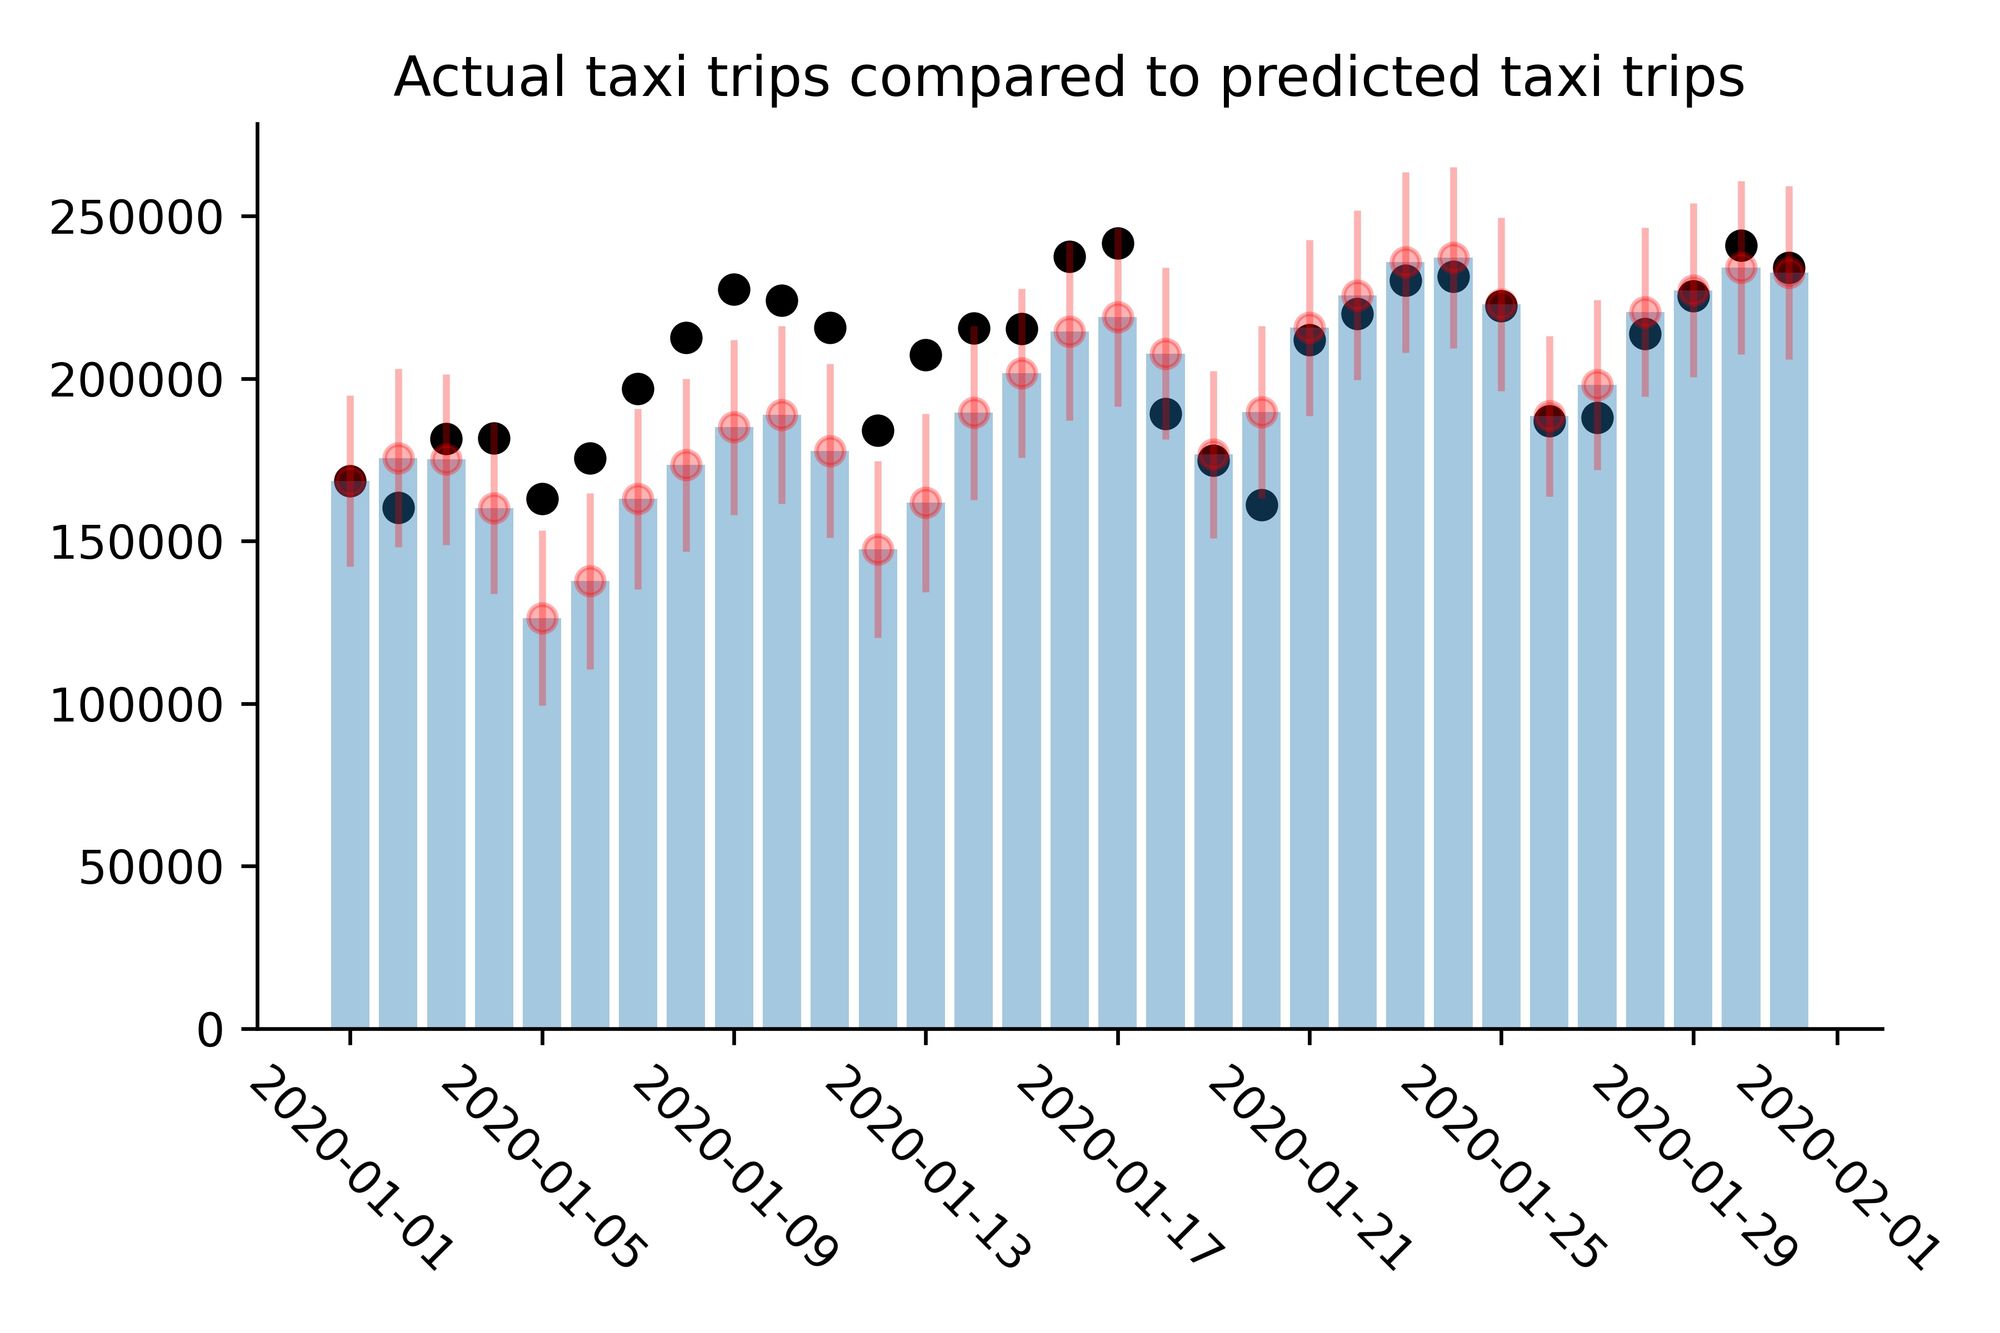
Create an alerts Pipe with an Endpoint to look at the actual January 2020 data and identify unusual days by comparing this data to the predictions.
Monitor the Endpoint to send alerts. You could test your Endpoint at the end of each day to see if the word ‘error’ appeared, and then investigate the anomaly.
Realtime alerts with predictions
For simplicity, this example uses daily data. For operational analysis in real time the periodicity can be a much shorter time. Within Tinybird, every minute we run API Endpoints on operational logs to notify us of anomalous conditions, allowing us to adjust systems to keep services running optimally.
Although you can do a great deal of analysis of your realtime data using SQL, there is no need to forego the use of modelling techniques in other environments. With Tinybird you can mix-and-match to maximise effectiveness in your realtime analysis of your data.