


We use ClickHouse® under the hood, and it lets some of our customers query hundreds of billions of rows per hour in real time.
But this doesn’t come without challenges. We still have to think very carefully when writing queries and designing how we store and process data. It is an iterative process and when data or concurrency increase, some queries have to be rewritten to maintain performance.
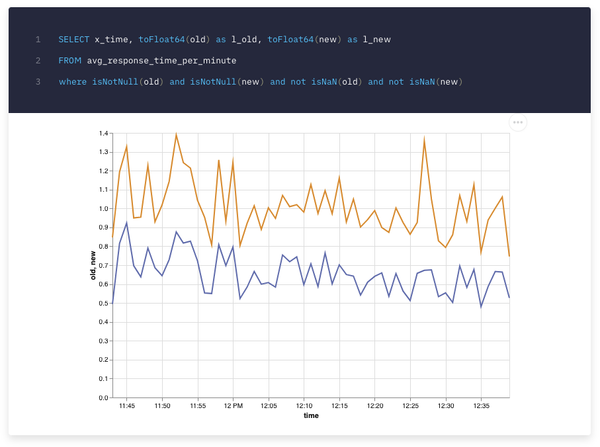
Monitoring API response times
Our enterprise tier includes performance (QPS and latency) SLAs that our platform needs to satisfy. We provide a platform where our customers can store, process and define dynamic API endpoints to query their data.
As users can define arbitrary endpoints, some of them could end up being too computationally expensive and slow. That would have an impact on performance, so to meet the SLAs we sometimes also help our enterprise customers optimize their data schemas and their queries.
Monitoring the requests made to those endpoints and their duration is fundamental to know how well the system is performing and whether more work has to be done to meet performance requirements.
This log data is available for all Tinybird accounts via the tinybird.pipe_stats_rt service data source, for the past two days.
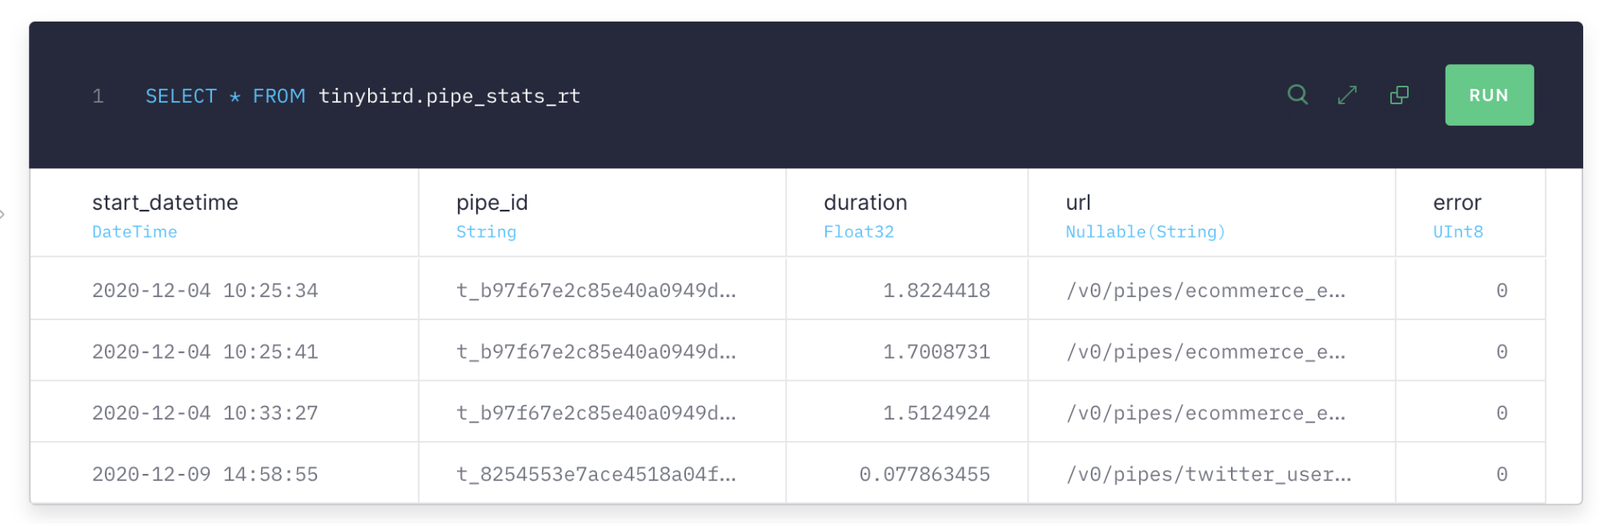
But even if you don’t use Tinybird, if you have requests logs for your app’s endpoints, you could do a similar analysis to the one we explain below.
Correlating presence or absence of query parameters with response times
The goal here is detecting what parameters have a bigger impact on query complexity when they’re present in the request URLs, and then modifying those queries or the underlying schemas to keep response times low.
For any given endpoint, if response times are higher when a certain parameter appears in the request URL, and they’re lower when it doesn’t appear, the correlation between response times and whether that parameter was included in the URL will be high.
Computing whether and which parameters appear in each request URL can be done with some of the string search functions that ClickHouse® provides us with. To calculate whether the endpoint URL contains the word country, we’d add a column like:
We could also perform the previous step using extractURLParameter, another ClickHouse® function.
To add a column that counts the number of elements of a comma-separated-values parameter, we’d do:
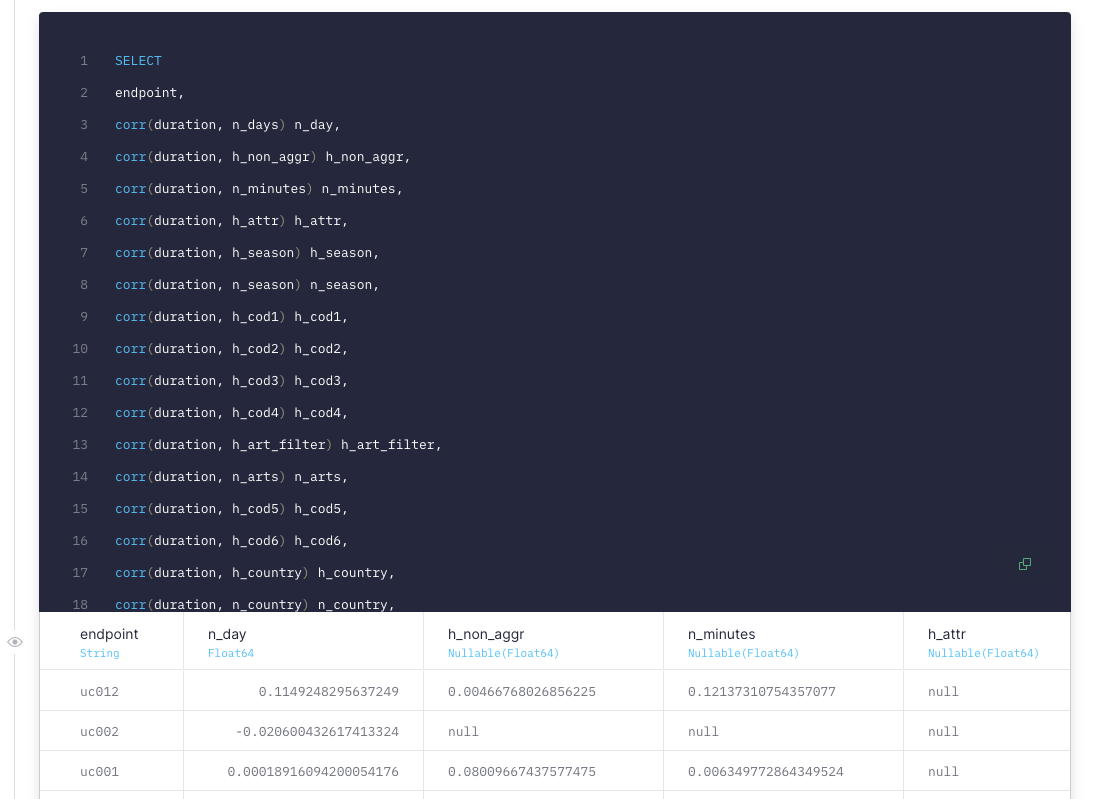
And finally, the last step is getting the correlation between whether a query string is present in the endpoint and the duration of the requests made to that endpoint. The higher the correlation, the longer the calls to that endpoint take when that parameter is present, and the more work will likely have to be done to bring request durations down.
We can also compute correlation within Tinybird and ClickHouse®, with the corr function
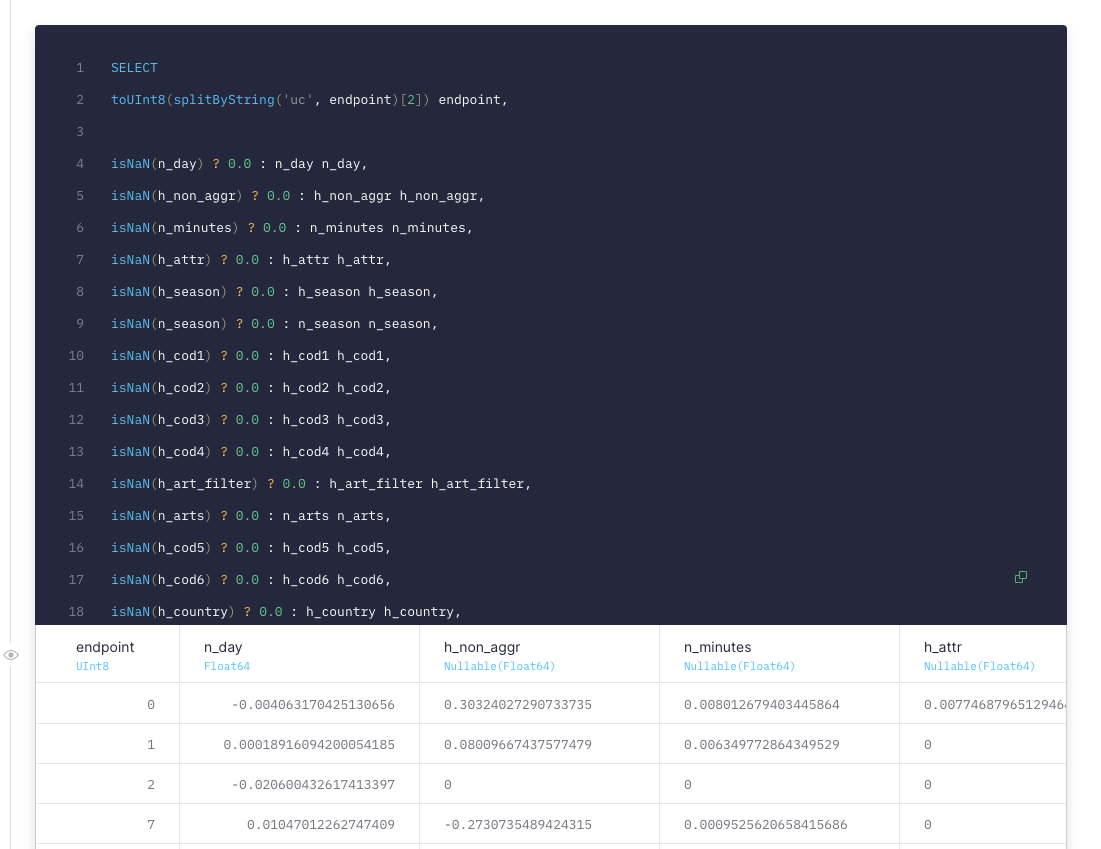
Some elements of the correlation matrix will probably be null (because a parameter was never present in an endpoint), so we’ll replace those null values with 0. ClickHouse® lets us do it with the ternary operator
Visualizing the correlation matrix in Google Sheets
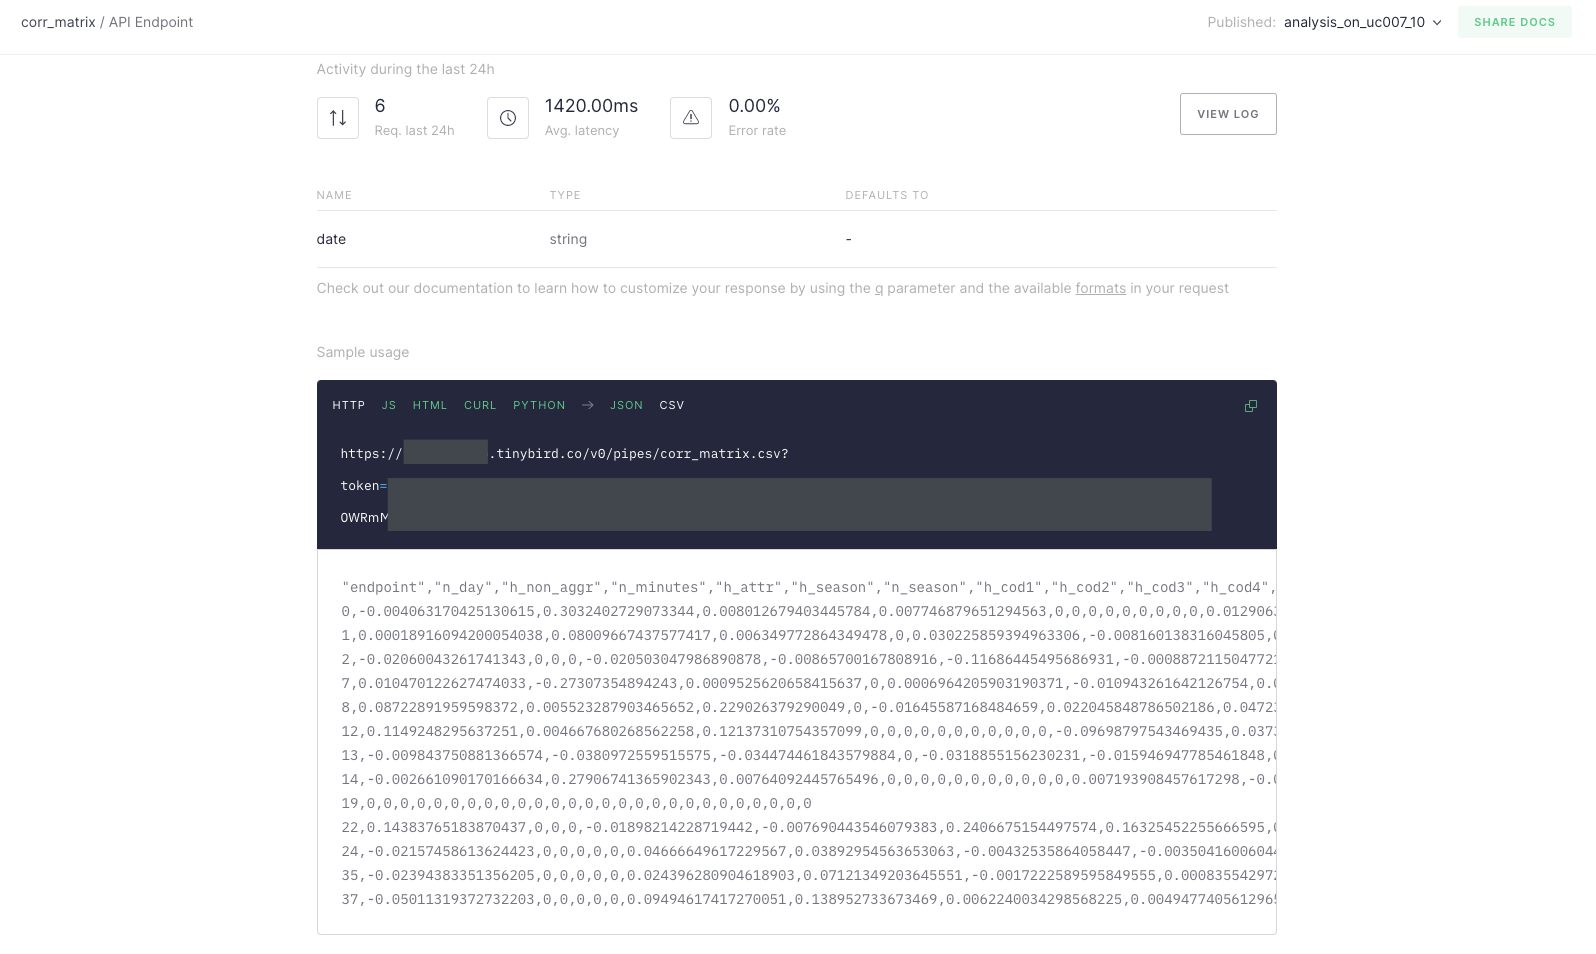
Tinybird allows you to expose the results of a pipe with a JSON or CSV API endpoint. Clicking on the View API button in the top right corner you’ll see a self-documenting page for the endpoint exposed:
And with the IMPORTDATA function available in Google Sheets, we can import the results into a spreadsheet, where we can visualize them much better:
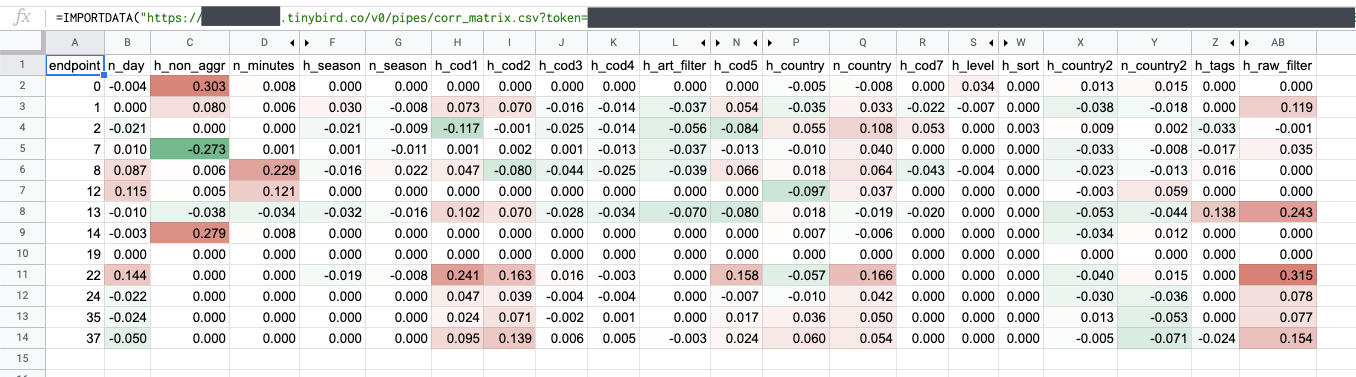
What did we do to fix it?
For example, in this case we’d see that the endpoints 0, 1 and 14 tend to be slower with non-aggregated data (h_non_aggr). To fix it, we partitioned the table and set a good sorting key so that it does not have to do a full scan every time.
Also, the bigger the range of dates we’re reading data from (n_day), the slower endpoints 8, 12 and 22 are. To deal with bigger date ranges, the way to go would be merging data from materialized views with different temporal aggregations, depending on the date range of the current query.
We also noticed that endpoints filtered by country (h_country, h_country2) tend to be faster (except endpoint 2, due to an expensive array filtering). So we reduced the amount of threads needed for those queries so that other queries had more threads available.
More things: we saw that h_raw_filter impacts performance on most of the endpoints. This is due to an expensive IN filter to a big dimensions Data Source. We did nothing because it would have complicated the logic of other endpoints, but it’s a place where to improve for the future.
And finally: the bigger h_page_size is, the slower the queries are. There is nothing to do here. The developers that integrate the endpoints should take it into account, and therefore request smaller page sizes and implement infinite scrolling or similar.
That’s it! If you’d like to learn more about building real-time analytics systems that perform well over billions of rows, check out our Principles of Real Time Analytics free course
Tinybird is the way to build real-time data products. If you too think Data should be analysed as it happens and without worrying about scale, sign-up for an account.