


Is there a Platform team out there that isn't using Grafana? We certainly are at Tinybird. Grafana is our best friend.
That said, like any friend, it can get on your nerves a bit.
Grafana has a rich plugin ecosystem that extends its features and enables integrations with many different data sources. This can be very convenient. For example, you can connect Grafana to ClickHouse® to visualize real-time analytics data.
But, there's a common problem: Slow dashboards.

Many of these data sources weren’t intended to power interactive visualizations. Snowflake is a top data source plugin for Grafana, but Snowflake isn’t built to return queries in milliseconds. So your Grafana might feel a bit sluggish.
Slapping together a suboptimal query or two is fine for prototyping, but slow queries certainly won’t help the hamster spin the wheel any faster (that’s how the Cloud is powered, right?)
Furthermore, if you want to connect to and query from these many distinct data sources, you’ll also need broad knowledge of each of them. That might lead you to a lot of frustrated googling and fact-checking ChatGPT before you find the right answer somewhere in the bowels of StackOverflow.
And with so many charts with their queries hidden away inside the panel settings, you can end up with a bit of a mess. If you’re like us, your Grafana is probably full of slow, duplicated queries. It’s a nightmare to maintain code in a system that wasn’t built for version control. And don’t even get me started on access control.
So, what’s new?
Grab the keys to your Grafana, roll those windows down, and feel the wind in your hair. The weather’s great, and we’re gonna go fast.

Today, we’re launching the new Tinybird Data Source plugin for Grafana.
With the Tinybird Grafana plugin, you can take advantage of the power of Tinybird to ingest, query and publish your events, metrics, log analytics, and telemetry data. Then, connect Grafana and build the dashboard of your dreams.
Except, this time, they’re going to be the fastest charts you’ve ever seen.
Your queries live outside of Grafana: stored and versioned in Git, and published to Tinybird. Inside Grafana, all you need to do is add a new panel, select your blazing fast query from a dropdown, and visualize the result however you want.
All Tinybird queries are secured by Auth Tokens, so you can flexibly provide access to specific data sets, and re-use queries in as many panels as needed.
It’s the same Grafana you know and love, just so, so, so much faster.
How to use the Tinybird plugin for Grafana
1. Install the Tinybird Data Source
Find the latest release bundle from GitHub and copy the URL to the zip.
Use the Grafana CLI to install the plugin from the URL, for example:
You'll also need to make sure to enable unsigned plugins in your Grafana config.
After you do that, go ahead and restart your Grafana.
Please let us know if you’d want to see us officially listed in the Grafana Marketplace. If you don’t tell us, we won’t know!
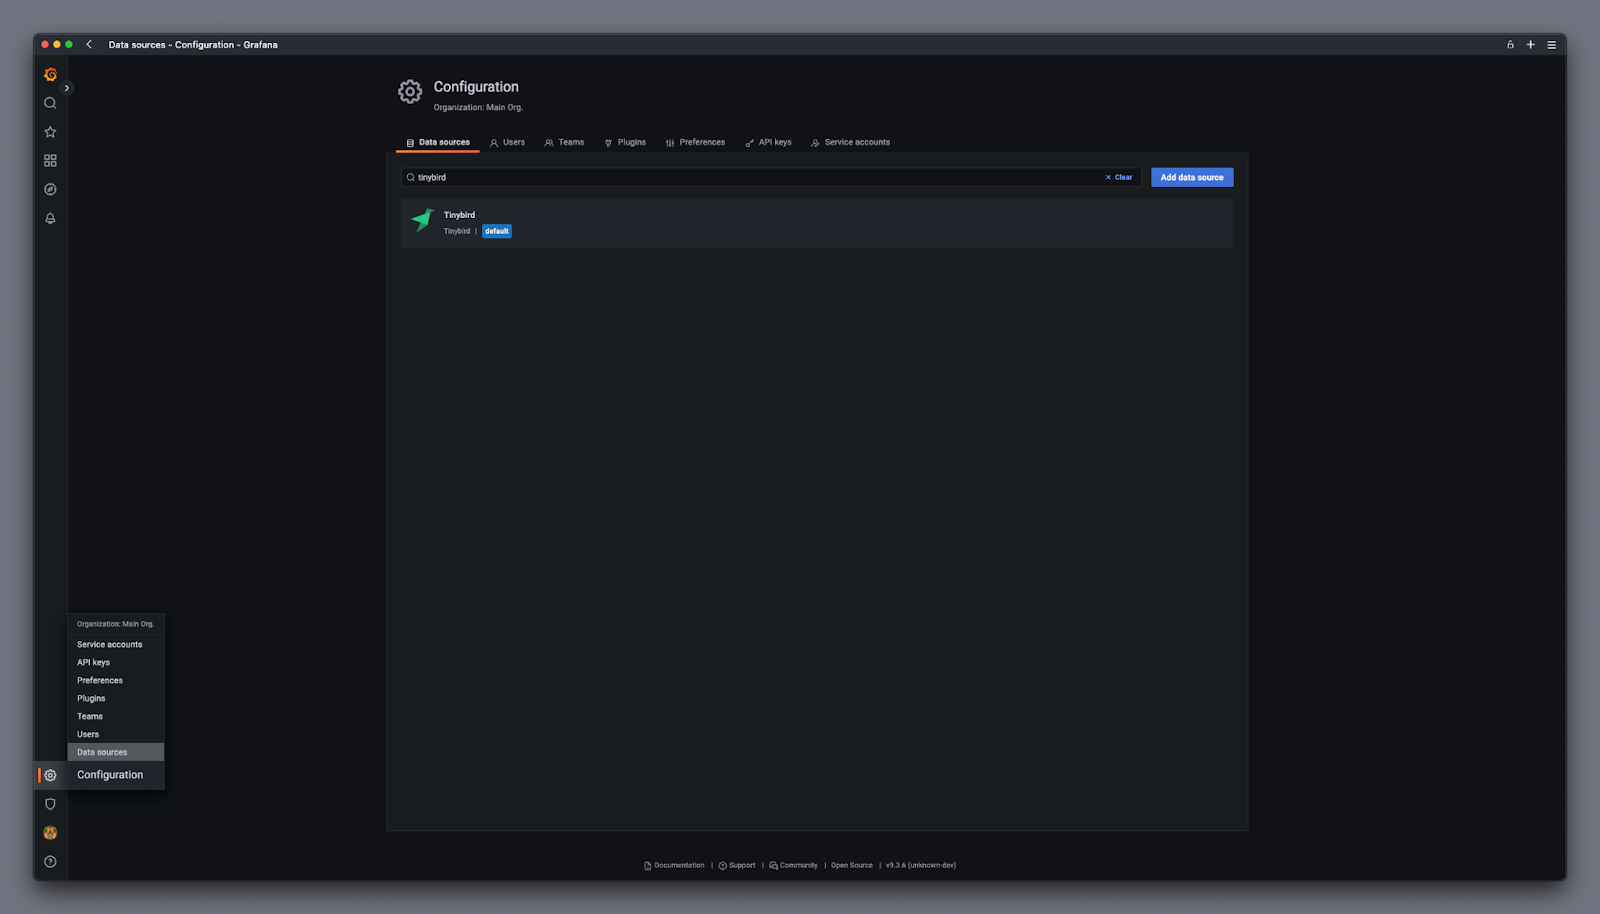
2. Add a new Data Source, and select Tinybird
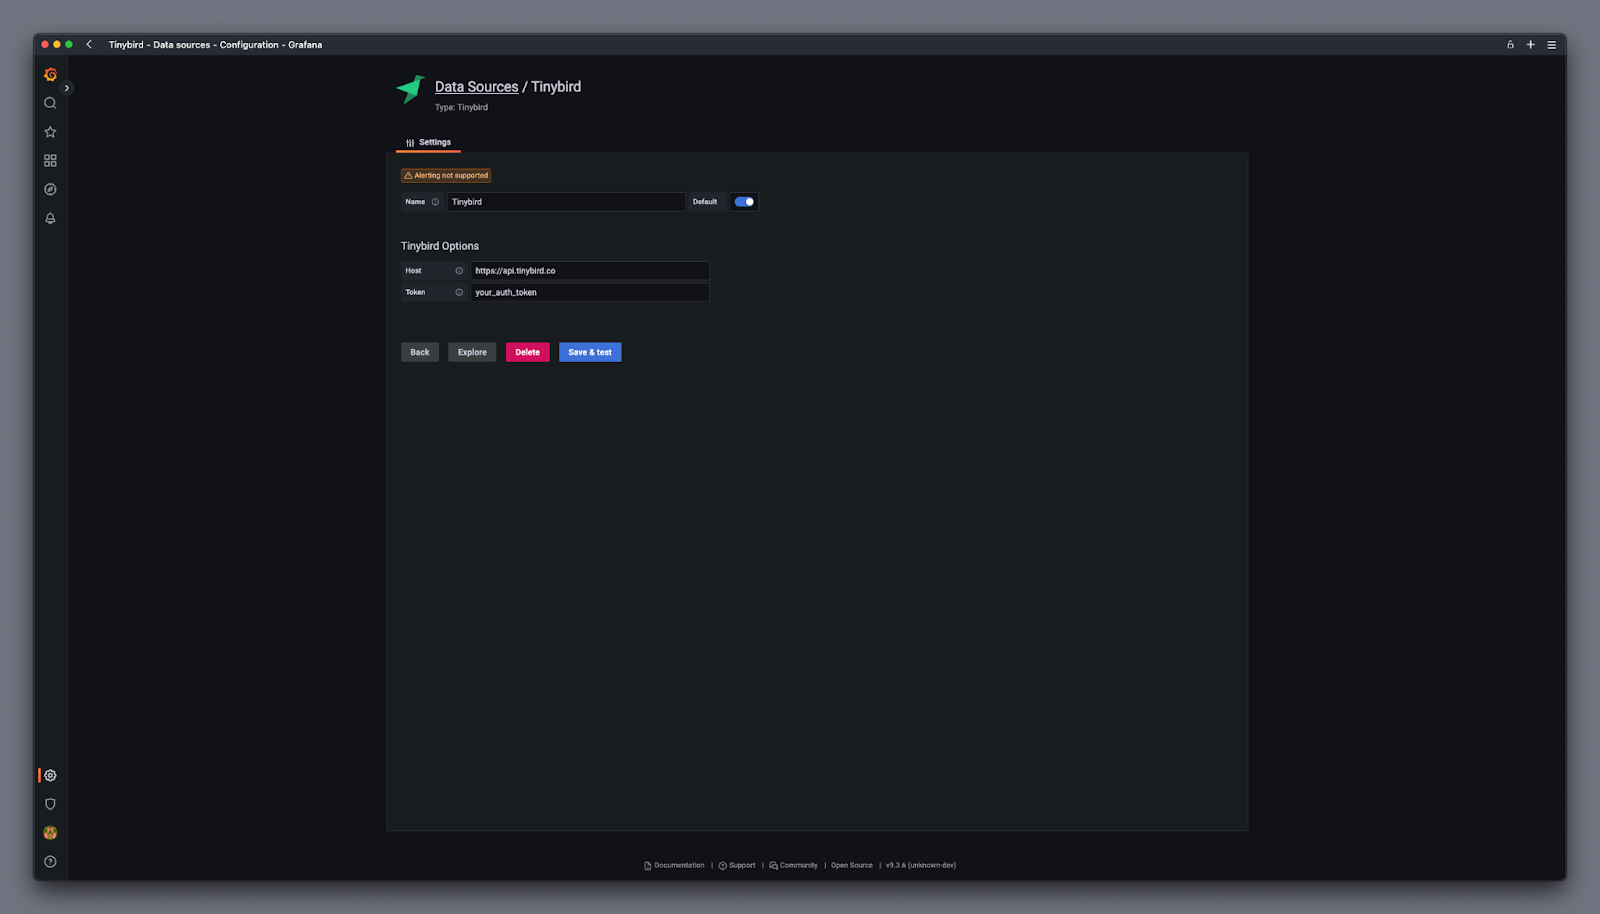
3. Configure the Data Source
Add the Tinybird Endpoint you are using (make sure to choose the right region). Then, paste in your Tinybird Auth Token.
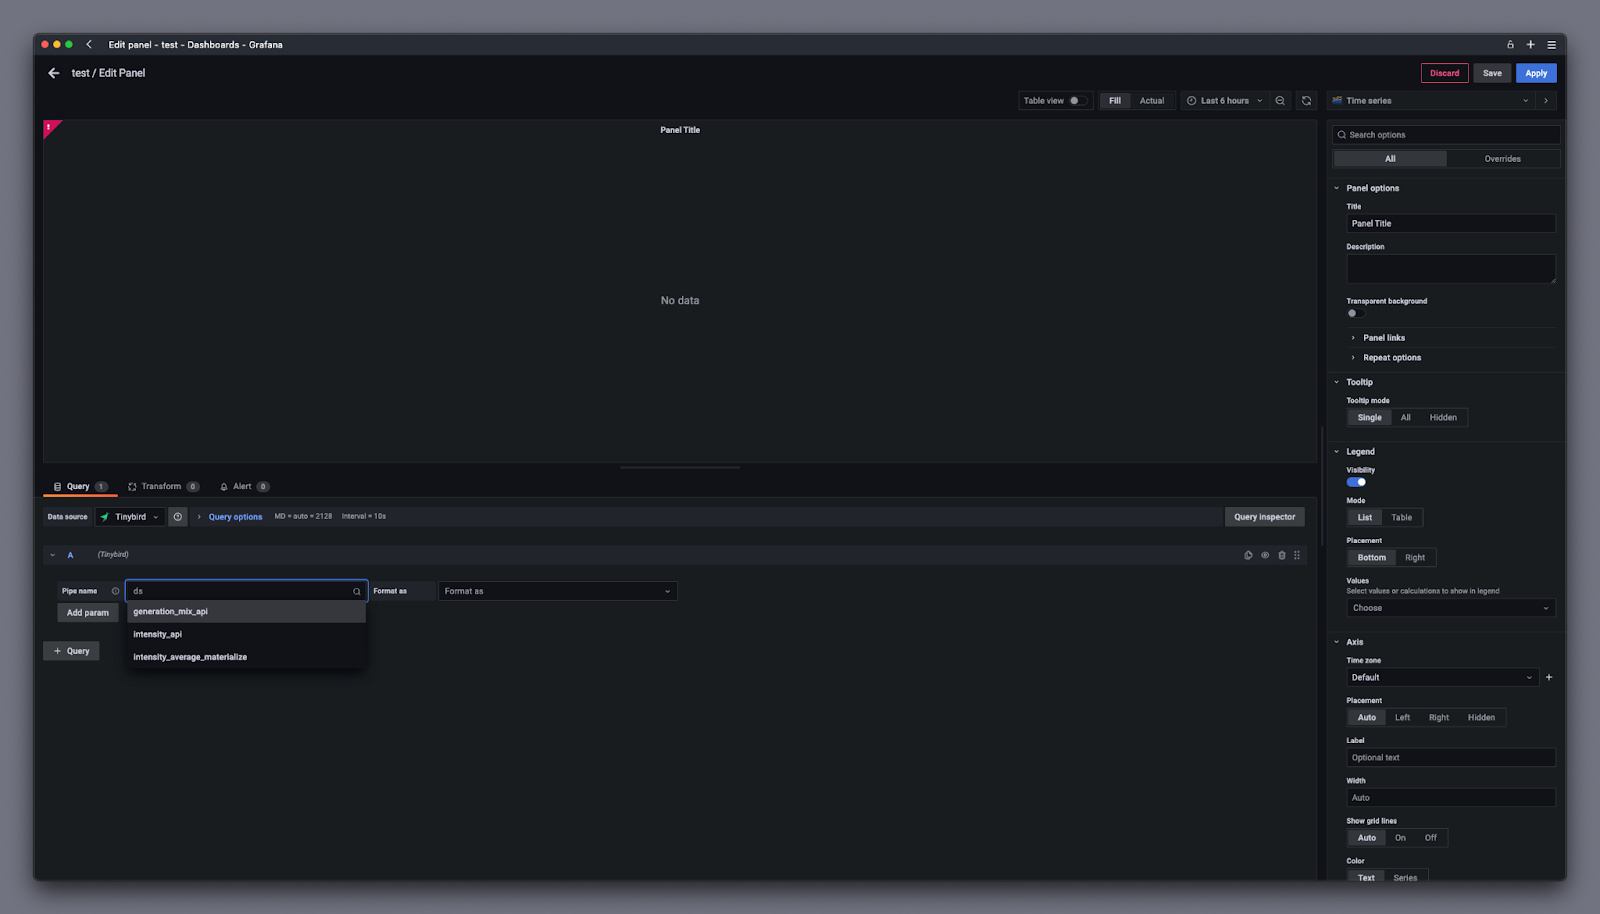
4. Add a new dashboard panel
Select Tinybird as the Data Source, and then select the query you want to visualize from the dropdown.
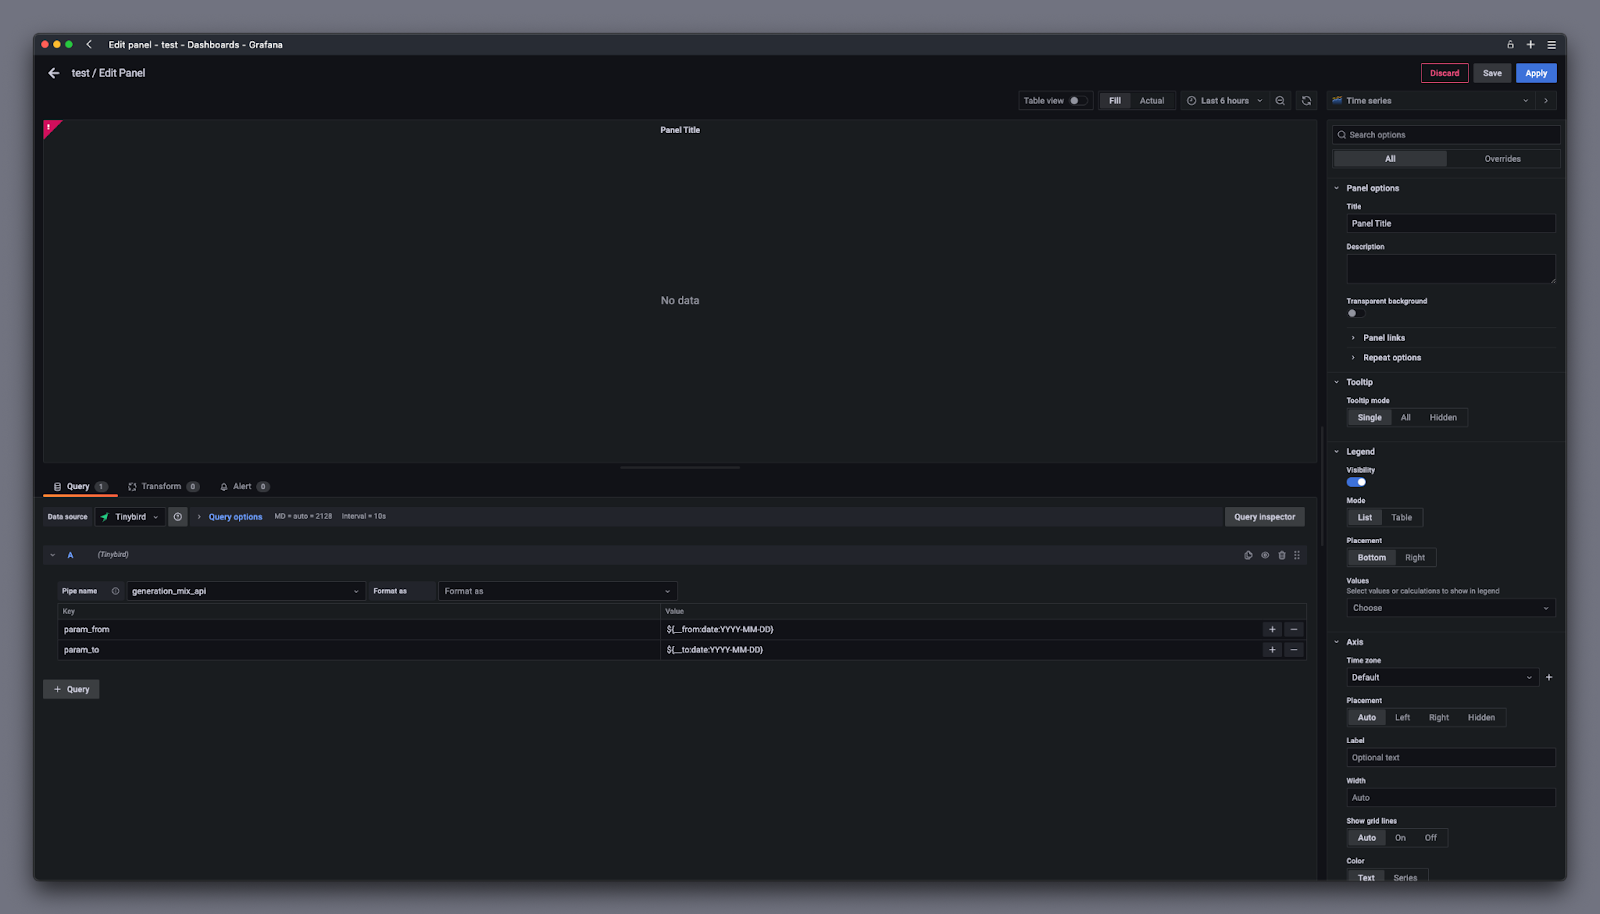
You can supply optional query parameters in the table below, for example, to provide a date range or any other custom parameters in your queries.
5. Done!
Build with Tinybird & Grafana today
You can sign up for a free Tinybird account and start building today, no credit card required. Tinybird’s Build plan is free, with no time limit, and has everything you need for small projects. Need to go Pro? Use the code TINY_LAUNCH_WEEK for $300 in credit when you upgrade to the Pro plan.