


In this blog post, you'll build a complete real-time analytics API from Kafka. We'll start with the basics, connecting to Kafka and creating a simple API endpoint in about 5 minutes.
Then we'll progressively add advanced features: data enrichment with dimension tables and PostgreSQL, materialized views for fast aggregations and multiple API endpoints, all without writing any application code.
What You'll Build
By the end of this tutorial, you'll have:
- A serverless Kafka connector ingesting order events in real-time
- A simple API endpoint querying raw Kafka data
- Enriched data using dimension tables (products, customers)
- PostgreSQL enrichment for product catalog data
- Materialized views for pre-aggregated metrics
- Advanced API endpoints with real-time analytics
Architecture Overview
Here's the complete data flow we'll build:
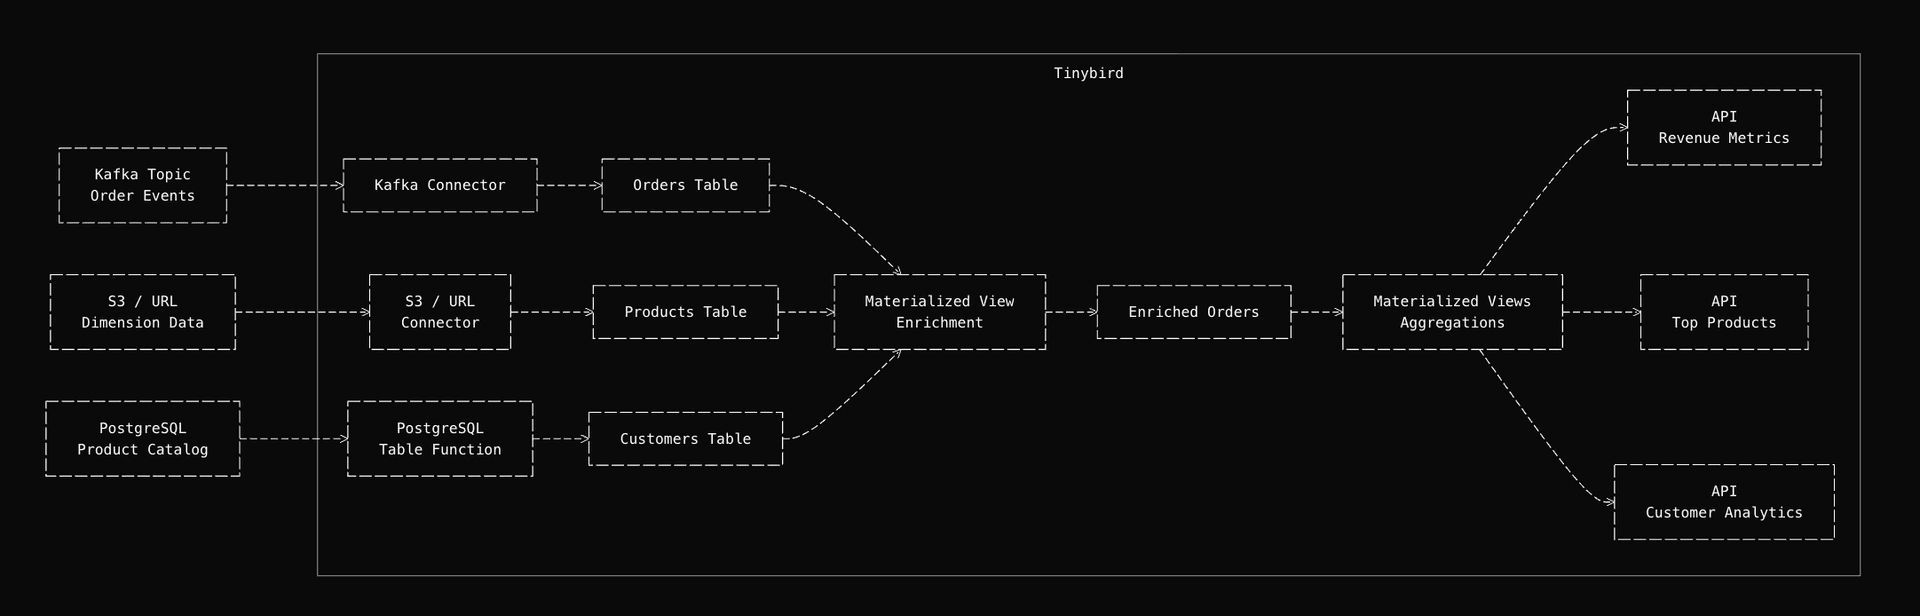
The pipeline starts simple: events arrive from Kafka and are immediately queryable via API endpoints. Then we enhance it by enriching events with reference data from dimension tables and PostgreSQL. Next, we pre-aggregate metrics in materialized views for fast queries. Finally, we serve them through low-latency API endpoints.
Prerequisites
Before you start, make sure you have:
- A Tinybird account (sign up free)
- The Tinybird CLI installed (installation guide)
- Access to a Kafka cluster (Confluent Cloud, AWS MSK or self hosted)
- A PostgreSQL database (optional, for enrichment example)
- Basic familiarity with SQL
Part 1: Kafka to API - Get Started in 5 Minutes
Let's start with the basics: connect to Kafka and create a simple API endpoint. This gives you a working API in minutes, then we'll add advanced features.
Step 1: Connect Kafka to Your Analytics Pipeline
First, let's create a Kafka connection. You can do this via the CLI or manually.
Option 1: Using the CLI (Recommended)
Run the interactive command:
tb connection create kafka
You'll be prompted for:
- Connection name (e.g.,
ecommerce_kafka) - Bootstrap server (e.g.,
pkc-xxxxx.us-east-1.aws.confluent.cloud:9092) - Kafka key (API key for Confluent Cloud, or username)
- Kafka secret (API secret for Confluent Cloud, or password)
The CLI will create a .connection file for you.
Throughout this guide, we use tb --cloud to deploy to Tinybird Cloud and tb (without the flag) to deploy to your local Tinybird environment. Use tb --cloud deploy when you're ready to deploy to production and tb deploy for local testing and development. Same for secrets, append, connection etc.
Option 2: Manual Connection File
Alternatively, create a connection file manually:
TYPE kafka
KAFKA_BOOTSTRAP_SERVERS pkc-xxxxx.us-east-1.aws.confluent.cloud:9092
KAFKA_SECURITY_PROTOCOL SASL_SSL
KAFKA_SASL_MECHANISM PLAIN
KAFKA_KEY {{ tb_secret("KAFKA_KEY") }}
KAFKA_SECRET {{ tb_secret("KAFKA_SECRET") }}
Set your secrets:
tb secret set KAFKA_KEY your_kafka_key
tb secret set KAFKA_SECRET your_kafka_secret
Validate the Connection
Kafka connections have multiple settings (bootstrap servers, security protocols, SASL mechanisms, SSL configurations, etc.) and client libraries usually don't do great error handling. Having a preview of your data and a troubleshooting guide at hand is essential before proceeding.
Test your connection:
tb connection data kafka_ecommerce
This validates connectivity, authentication and can preview messages from your topics. You should see output like:
✓ Connection validated successfully
✓ Found 3 topics
  - orders (12 partitions)
  - payments (8 partitions)
  - shipping (6 partitions)
✓ Sample message from 'orders' topic:
  {"order_id": "ord_12345", "customer_id": "cust_67890", ...}
If you see errors, check:
- Bootstrap server address is correct and reachable
- Credentials are set correctly with
tb secret list - Network connectivity (firewall rules, security groups)
- Kafka cluster is running and accessible
For detailed troubleshooting steps and solutions to common connection issues, see the Kafka connector troubleshooting guide.
Step 2: Create Kafka Data Source for Real-Time Ingestion
Now let's create a Data Source that consumes from your Kafka topic.
Using the CLI
tb datasource create --kafka
This interactive command will:
- Let you select your Kafka connection
- List available topics
- Preview message structure
- Generate a schema automatically
Manual Data Source Creation
Or create the Data Source file manually. Here's an example for order events:
SCHEMA >
    `order_id` String `json:$.order_id`,
    `customer_id` String `json:$.customer_id`,
    `product_id` Int32 `json:$.product_id`,
    `quantity` Int32 `json:$.quantity`,
    `price` Decimal(10, 2) `json:$.price`,
    `order_total` Decimal(10, 2) `json:$.order_total`,
    `timestamp` DateTime `json:$.timestamp`,
    `payment_method` LowCardinality(String) `json:$.payment_method`,
    `shipping_address` String `json:$.shipping_address`

ENGINE MergeTree
ENGINE_PARTITION_KEY toYYYYMM(timestamp)
ENGINE_SORTING_KEY timestamp, order_id

KAFKA_CONNECTION_NAME kafka_ecommerce
KAFKA_TOPIC orders
KAFKA_GROUP_ID {{ tb_secret("KAFKA_GROUP_ID", "ecommerce_consumer") }}
KAFKA_AUTO_OFFSET_RESET latest
The KAFKA_GROUP_ID uniquely identifies your consumer group. Each combination of KAFKA_TOPIC and KAFKA_GROUP_ID can only be used in one Data Source, this ensures offset tracking works correctly and prevents conflicts.
Best practices:
- Use unique group IDs per Data Source when consuming from the same topic
- Use environment-specific group IDs to isolate consumers and their committed offsets:
- Local:
"ecommerce_consumer_local"(or default"ecommerce_consumer") - Staging:
"ecommerce_consumer_staging" - Production:
"ecommerce_consumer_prod"
- Local:
You can manage group IDs using secrets with defaults:
# Set different group IDs for each environment
tb secret set KAFKA_GROUP_ID ecommerce_consumer_local          # Local
tb --cloud --host <STAGING_HOST> secret set KAFKA_GROUP_ID ecommerce_consumer_staging  # Staging
tb --cloud --host <PROD_HOST> secret set KAFKA_GROUP_ID ecommerce_consumer_prod        # Production
The {{ tb_secret("KAFKA_GROUP_ID", "ecommerce_consumer") }} syntax uses the secret value if set, or falls back to the default "ecommerce_consumer" if not set. This makes it easy to use different group IDs across environments without changing your Data Source files.
For more details on managing consumer groups across environments, see the CI/CD and version control guide.
Schema optimization notes:
- Decimal types: We use
Decimal(10, 2)forpriceandorder_totalto ensure precise financial calculations without floating-point rounding errors - LowCardinality:
payment_methodusesLowCardinality(String)since it has few unique values (credit_card, debit_card, paypal, etc.), which reduces storage and improves query performance - Sorting key: The sorting key
(timestamp, order_id)is optimized for time series queries. Always include columns you frequently filter by in your sorting key, in this case,timestampfor time range queries andorder_idfor order lookups - Partitioning: Monthly partitioning by
toYYYYMM(timestamp)keeps partitions manageable and enables efficient data management
Sample Kafka Message
Your Kafka messages should look like this:
{
  "order_id": "ord_12345",
  "customer_id": "cust_67890",
  "product_id": 42,
  "quantity": 2,
  "price": 29.99,
  "order_total": 59.98,
  "timestamp": "2025-01-27T10:30:00Z",
  "payment_method": "credit_card",
  "shipping_address": "123 Main St, New York, NY 10001"
}
Verify Data Ingestion
Before deploying, you can test locally:
# Deploy to local environment (Tinybird Local)
tb deploy

# Check if data is flowing
tb sql "SELECT count(*) FROM orders_kafka"
Once verified locally, deploy to cloud:
# Deploy to Tinybird Cloud
tb --cloud deploy
Remember: tb deploy deploys to your local Tinybird environment, while tb --cloud deploy deploys to Tinybird Cloud. Use local deployment for testing and cloud deployment for production.
After deployment, verify ingestion is working:
-- Check recent orders
SELECT
    count(*) as total_orders,
    min(timestamp) as first_order,
    max(timestamp) as last_order
FROM orders_kafka
WHERE timestamp > now() - INTERVAL 1 hour
Data will start flowing into Tinybird as soon as messages arrive in your Kafka topic. You can monitor ingestion in the Tinybird UI or query the data directly.
For comprehensive monitoring of your Kafka connector, including consumer lag, throughput and error tracking, see the Kafka monitoring guide. You can query the tinybird.kafka_ops_log Service Data Source to diagnose issues with your Kafka connector in real time.
Step 3: Create Your First API Endpoint
Now let's create a simple API endpoint that queries your raw Kafka data. This demonstrates how easy it is to expose Kafka data as an API:
TOKEN "metrics_api_token" READ

DESCRIPTION >
    Simple endpoint to query recent orders from Kafka

NODE recent_orders
SQL >
    %
    SELECT
        order_id,
        customer_id,
        product_id,
        quantity,
        price,
        order_total,
        timestamp,
        payment_method
    FROM orders_kafka
    WHERE timestamp >= toDateTime({{ String(start_time, '2025-01-27 00:00:00', description='Start time (YYYY-MM-DD HH:MM:SS)') }})
      AND timestamp <= toDateTime({{ String(end_time, '2025-01-27 23:59:59', description='End time (YYYY-MM-DD HH:MM:SS)') }})
    ORDER BY timestamp DESC
    LIMIT {{ Int32(limit, 100, description='Maximum number of results') }}
Deploy and test your endpoint:
# Deploy to cloud
tb --cloud deploy

# Test the endpoint
curl "https://api.tinybird.co/v0/pipes/recent_orders.json?token=YOUR_TOKEN&start_time=2025-01-27%2000:00:00&end_time=2025-01-27%2023:59:59&limit=10"
That's it! You now have a working API endpoint querying Kafka data in real time. In the next sections, we'll add enrichment, materialized views and more advanced endpoints.
Part 2: Enrich Data with Dimension Tables
Now let's enhance your pipeline by adding dimension tables for data enrichment.
Step 1: Set Up Dimension Tables for Data Enrichment
Dimension tables store reference data that we'll use to enrich order events. Let's create tables for products and customers.
Products Dimension Table
SCHEMA >
    `product_id` Int32,
    `product_name` String,
    `category` LowCardinality(String),
    `brand` LowCardinality(String),
    `base_price` Decimal(10, 2),
    `created_at` DateTime

ENGINE MergeTree
ENGINE_SORTING_KEY product_id
Customers Dimension Table
SCHEMA >
    `customer_id` String,
    `customer_name` String,
    `email` String,
    `country` LowCardinality(String),
    `customer_segment` LowCardinality(String),
    `registration_date` DateTime

ENGINE MergeTree
ENGINE_SORTING_KEY customer_id
Load Dimension Data
You can load data into these tables using the Events API, S3 URLs, or Copy Pipes. For automated ingestion from S3, use the S3 connector to automatically sync dimension data when files are updated in your bucket.
For dimension tables that are relatively small (up to a few million rows), using MergeTree with replace is simpler and ensures data consistency. When updating dimension data, use replace instead of append to atomically update the entire table:
# Replace all products from S3 URL (atomic operation)
tb datasource replace products s3://my-bucket/dimension-data/products.csv

# Replace all customers from S3 URL (atomic operation)
tb datasource replace customers s3://my-bucket/dimension-data/customers.csv
For larger dimension tables or when you need incremental updates, you can use ReplacingMergeTree with append operations.
This allows deduplication during merges, but requires using FINAL in JOINs to get the latest version of each record. For most use cases with small dimension tables, MergeTree + replace is simpler and more straightforward.
Step 2: Enrich Kafka Events with Dimension Data
Now let's create a Materialized View that enriches order events with product and customer data at ingestion time.
First, create the datasource file:
SCHEMA >
    `order_id` String,
    `customer_id` String,
    `product_id` String,
    `quantity` Int32,
    `price` Decimal(10, 2),
    `order_total` Decimal(10, 2),
    `timestamp` DateTime,
    `payment_method` LowCardinality(String),
    `shipping_address` String,
    `product_name` String,
    `product_category` LowCardinality(String),
    `product_brand` String,
    `product_base_price` Decimal(10, 2),
    `customer_name` String,
    `customer_country` LowCardinality(String),
    `customer_segment` LowCardinality(String),
    `discount_amount` Decimal(10, 2)

ENGINE MergeTree
ENGINE_PARTITION_KEY toYYYYMM(timestamp)
ENGINE_SORTING_KEY timestamp, order_id
Then create the materialized view pipe:
NODE enriched_orders
SQL >
    SELECT
        o.order_id,
        o.customer_id,
        o.product_id,
        o.quantity,
        o.price,
        o.order_total,
        o.timestamp,
        o.payment_method,
        o.shipping_address,
        -- Enrich with product data using JOIN
        p.product_name,
        p.category as product_category,
        p.brand as product_brand,
        p.base_price as product_base_price,
        -- Enrich with customer data
        c.customer_name,
        c.country as customer_country,
        c.customer_segment,
        -- Calculate derived fields
        o.order_total - (o.quantity * p.base_price) as discount_amount
    FROM orders_kafka o
    LEFT JOIN products p ON o.product_id = p.product_id
    LEFT JOIN customers c ON o.customer_id = c.customer_id

TYPE materialized
DATASOURCE enriched_orders
Since we're using MergeTree with replace for dimension tables, we don't need FINAL in the JOINs.
The replace operation ensures the tables always contain the latest data. This makes JOINs straightforward and performant for small dimension tables (up to a few million rows).
This Materialized View automatically processes new orders as they arrive from Kafka.
Deploy it:
tb deploy
Part 3: Add PostgreSQL Enrichment
Step 1: Sync PostgreSQL Data for Real-Time Enrichment
For data that lives in PostgreSQL (like a product catalog that's updated frequently), we can use the PostgreSQL table function to sync it into Tinybird.
Set Up PostgreSQL Secrets
tb secret set pg_database ecommerce
tb secret set pg_username postgres
tb secret set pg_password your_password
Note: The PostgreSQL host and port are specified directly in the Copy Pipe as 'your-postgres-host.com:5432'. Update this placeholder with your actual PostgreSQL connection string.
Create a Copy Pipe to Sync Product Catalog
NODE sync_catalog
SQL >
    SELECT
        product_id,
        product_name,
        category,
        brand,
        base_price,
        description,
        updated_at
    FROM postgresql(
        'your-postgres-host.com:5432',
        {{ tb_secret('pg_database') }},
        'product_catalog',
        {{ tb_secret('pg_username') }},
        {{ tb_secret('pg_password') }}
    )

TYPE COPY
TARGET_DATASOURCE product_catalog_synced
COPY_MODE replace
COPY_SCHEDULE "*/15 * * * *"  -- Sync every 15 minutes
This Copy Pipe:
- Reads from your PostgreSQL
product_catalogtable - Replaces the entire
product_catalog_syncedData Source on each run (atomic operation) - Runs every 15 minutes automatically
- Uses
COPY_MODE replaceto ensure the synced table always matches PostgreSQL
For dimension tables that are relatively small (up to a few million rows), using replace is recommended as it's simpler and ensures data consistency.
Use PostgreSQL Data in Enrichment
Update your enrichment Materialized View to also use PostgreSQL-synced data. First, update the datasource schema to include the product description:
SCHEMA >
    `order_id` String,
    `customer_id` String,
    `product_id` String,
    `quantity` Int32,
    `price` Decimal(10, 2),
    `order_total` Decimal(10, 2),
    `timestamp` DateTime,
    `payment_method` LowCardinality(String),
    `shipping_address` String,
    `product_name` String,
    `product_category` LowCardinality(String),
    `product_brand` String,
    `product_base_price` Decimal(10, 2),
    `product_description` String,
    `customer_name` String,
    `customer_country` LowCardinality(String),
    `customer_segment` LowCardinality(String),
    `discount_amount` Decimal(10, 2)

ENGINE MergeTree
ENGINE_PARTITION_KEY toYYYYMM(timestamp)
ENGINE_SORTING_KEY timestamp, order_id
Then update the materialized view pipe:
NODE enriched_orders
SQL >
    SELECT
        o.order_id,
        o.customer_id,
        o.product_id,
        o.quantity,
        o.price,
        o.order_total,
        o.timestamp,
        o.payment_method,
        o.shipping_address,
        -- Dimension table enrichment (fast, always available)
        p.product_name,
        p.category as product_category,
        p.brand as product_brand,
        p.base_price as product_base_price,
        -- PostgreSQL-synced data (updated every 15 minutes)
        pg.description as product_description,
        -- Customer enrichment
        c.customer_name,
        c.country as customer_country,
        c.customer_segment,
        -- Calculate derived fields
        o.order_total - (o.quantity * p.base_price) as discount_amount
    FROM orders_kafka o
    LEFT JOIN products p ON o.product_id = p.product_id
    LEFT JOIN customers c ON o.customer_id = c.customer_id
    LEFT JOIN product_catalog_synced pg ON o.product_id = pg.product_id

TYPE materialized
DATASOURCE enriched_orders
When to use dimension tables vs PostgreSQL:
- Dimension tables: For data that changes infrequently and needs sub millisecond lookups
- PostgreSQL sync: For data that changes frequently and is managed in your application database
Part 4: Create Materialized Views for Fast Analytics Queries
Now let's create Materialized Views that pre-aggregate metrics for fast API queries.
Revenue Metrics Materialized View
First, create the datasource file:
SCHEMA >
    `hour` DateTime,
    `product_category` LowCardinality(String),
    `customer_country` LowCardinality(String),
    `order_count` UInt64,
    `total_revenue` Decimal(10, 2),
    `avg_order_value` Decimal(10, 2),
    `total_units_sold` UInt32

ENGINE SummingMergeTree
ENGINE_PARTITION_KEY toYYYYMM(hour)
ENGINE_SORTING_KEY hour, product_category, customer_country
Then create the materialized view pipe:
NODE revenue_by_hour
SQL >
    SELECT
        toStartOfHour(timestamp) as hour,
        product_category,
        customer_country,
        count() as order_count,
        sum(order_total) as total_revenue,
        avg(order_total) as avg_order_value,
        sum(quantity) as total_units_sold
    FROM enriched_orders
    GROUP BY hour, product_category, customer_country

TYPE materialized
DATASOURCE revenue_metrics
Top Products Materialized View
First, create the datasource file:
SCHEMA >
    `hour` DateTime,
    `product_id` String,
    `product_name` String,
    `product_category` String,
    `order_count` UInt64,
    `units_sold` UInt32,
    `revenue` Decimal(10, 2)

ENGINE SummingMergeTree
ENGINE_PARTITION_KEY toYYYYMM(hour)
ENGINE_SORTING_KEY hour, product_id
Then create the materialized view pipe:
NODE top_products_hourly
SQL >
    SELECT
        toStartOfHour(timestamp) as hour,
        product_id,
        product_name,
        product_category,
        count() as order_count,
        sum(quantity) as units_sold,
        sum(order_total) as revenue
    FROM enriched_orders
    GROUP BY hour, product_id, product_name, product_category

TYPE materialized
DATASOURCE top_products
Customer Analytics Materialized View
First, create the datasource file:
SCHEMA >
    `customer_id` String,
    `customer_name` String,
    `customer_country` LowCardinality(String),
    `customer_segment` LowCardinality(String),
    `date` Date,
    `order_count` UInt64,
    `lifetime_value` Decimal(10, 2),
    `avg_order_value` Decimal(10, 2),
    `first_order_date` DateTime,
    `last_order_date` DateTime

ENGINE ReplacingMergeTree
ENGINE_PARTITION_KEY toYYYYMM(date)
ENGINE_SORTING_KEY customer_id, date
Then create the materialized view pipe:
NODE customer_metrics
SQL >
    SELECT
        customer_id,
        customer_name,
        customer_country,
        customer_segment,
        toStartOfDay(timestamp) as date,
        count() as order_count,
        sum(order_total) as lifetime_value,
        avg(order_total) as avg_order_value,
        min(timestamp) as first_order_date,
        max(timestamp) as last_order_date
    FROM enriched_orders
    GROUP BY customer_id, customer_name, customer_country, customer_segment, date

TYPE materialized
DATASOURCE customer_analytics
These Materialized Views update automatically as new orders arrive, keeping your metrics current.
Part 5: Build Advanced Real-Time Analytics API Endpoints
Now let's create advanced API endpoints that leverage materialized views for fast, aggregated queries.
Now let's create three API endpoints that serve real-time metrics.
Endpoint 1: Real-Time Revenue Metrics
TOKEN "metrics_api_token" READ

DESCRIPTION >
    Real-time revenue metrics by time window, category and country

NODE filtered_metrics
SQL >
    %
    SELECT *
    FROM revenue_metrics
    WHERE hour >= toDateTime({{ String(start_time, '2025-01-27 00:00:00', description='Start time (YYYY-MM-DD HH:MM:SS)') }})
      AND hour <= toDateTime({{ String(end_time, '2025-01-27 23:59:59', description='End time (YYYY-MM-DD HH:MM:SS)') }})
      {\% if defined(product_category) %}
      AND product_category = {{ String(product_category, description='Filter by product category') }}
      {\% endif %}
      {\% if defined(customer_country) %}
      AND customer_country = {{ String(customer_country, description='Filter by country') }}
      {\% endif %}

NODE aggregated
SQL >
    SELECT
        sum(order_count) as total_orders,
        sum(total_revenue) as total_revenue,
        avg(avg_order_value) as avg_order_value,
        sum(total_units_sold) as total_units_sold,
        min(hour) as period_start,
        max(hour) as period_end
    FROM filtered_metrics
    GROUP BY product_category, customer_country
    ORDER BY total_revenue DESC
This endpoint returns aggregated revenue metrics filtered by time range, product category and customer country, providing totals for orders, revenue, average order value and units sold.
Endpoint 2: Top Products
TOKEN "metrics_api_token" READ

DESCRIPTION >
    Top products by sales, revenue, or units sold

NODE filtered_products
SQL >
    %
    SELECT *
    FROM top_products
    WHERE hour >= toDateTime({{ String(start_time, '2025-01-27 00:00:00', description='Start time') }})
      AND hour <= toDateTime({{ String(end_time, '2025-01-27 23:59:59', description='End time') }})
      {\% if defined(category) %}
      AND product_category = {{ String(category, description='Filter by category') }}
      {\% endif %}

NODE ranked_products
SQL >
    SELECT
        product_id,
        product_name,
        product_category,
        sum(order_count) as total_orders,
        sum(units_sold) as total_units_sold,
        sum(revenue) as total_revenue
    FROM filtered_products
    GROUP BY product_id, product_name, product_category
    ORDER BY
        {\% if defined(sort_by) and sort_by == 'revenue' %}
        total_revenue
        {\% elif defined(sort_by) and sort_by == 'units' %}
        total_units_sold
        {\% else %}
        total_orders
        {\% endif %}
    DESC
    LIMIT {{ Int32(limit, 10, description='Number of products to return') }}
This endpoint returns the top-selling products ranked by orders, revenue, or units sold, with optional filtering by time range and product category.
Endpoint 3: Customer Analytics
TOKEN "metrics_api_token" READ

DESCRIPTION >
    Customer analytics including lifetime value and purchase patterns

NODE customer_stats
SQL >
    %
    SELECT
        customer_id,
        customer_name,
        customer_country,
        customer_segment,
        sum(order_count) as total_orders,
        sum(lifetime_value) as lifetime_value,
        avg(avg_order_value) as avg_order_value,
        min(first_order_date) as first_order_date,
        max(last_order_date) as last_order_date,
        dateDiff('day', min(first_order_date), max(last_order_date)) as customer_lifetime_days
    FROM customer_analytics
    WHERE date >= toDate({{ String(start_date, '2025-01-01', description='Start date (YYYY-MM-DD)') }})
      AND date <= toDate({{ String(end_date, '2025-01-27', description='End date (YYYY-MM-DD)') }})
      {\% if defined(customer_id) %}
      AND customer_id = {{ String(customer_id, description='Filter by customer ID') }}
      {\% endif %}
      {\% if defined(country) %}
      AND customer_country = {{ String(country, description='Filter by country') }}
      {\% endif %}
    GROUP BY customer_id, customer_name, customer_country, customer_segment
    ORDER BY lifetime_value DESC
    LIMIT {{ Int32(limit, 100, description='Number of customers to return') }}
This endpoint returns customer analytics including lifetime value, order counts, average order value and customer lifetime metrics, with optional filtering by customer ID, country and date range.
Step 8: Deploy and Test Your Analytics API
Deploy to Cloud
Deploy all resources to Tinybird Cloud:
# Deploy everything to cloud
tb --cloud deploy
This will:
- Create all Data Sources in your cloud workspace
- Deploy all Pipes and Materialized Views
- Set up the Kafka connector to start consuming
- Make your API endpoints available
Verify deployment:
# Open the Tinybird dashboard to view your resources
tb open

# Or run SQL queries directly from the CLI
tb --cloud sql "SELECT count(*) FROM orders_kafka"
Create API Token
The endpoints declare a token named metrics_api_token using TOKEN "metrics_api_token" READ in each pipe file. You can create JWT tokens using the CLI or generate them programmatically in your application.
For detailed instructions on creating JWT tokens, including CLI commands and programmatic examples, see the JWT tokens documentation.
The token name in the pipe files must match the token name you create. JWT tokens have a TTL (time to live) and require a --resource parameter pointing to the specific pipe name.
Test the Simple Endpoint
First, test the simple endpoint we created in Part 1:
curl "https://api.tinybird.co/v0/pipes/recent_orders.json?token=YOUR_TOKEN&start_time=2025-01-27%2000:00:00&end_time=2025-01-27%2023:59:59&limit=10"
Test the Revenue Metrics Endpoint
Replace YOUR_TOKEN with your actual token:
curl "https://api.tinybird.co/v0/pipes/api_revenue_metrics.json?token=YOUR_TOKEN&start_time=2025-01-27%2000:00:00&end_time=2025-01-27%2023:59:59"
Expected response:
{
  "meta": [
    {"name": "total_orders", "type": "UInt64"},
    {"name": "total_revenue", "type": "Decimal(10, 2)"},
    ...
  ],
  "data": [
    {
      "total_orders": 1523,
      "total_revenue": 45678.90,
      "avg_order_value": 29.98,
      "total_units_sold": 3046,
      "period_start": "2025-01-27 00:00:00",
      "period_end": "2025-01-27 23:00:00",
      "product_category": "Electronics",
      "customer_country": "US"
    }
  ],
  "rows": 1,
  "statistics": {
    "elapsed": 0.012,
    "rows_read": 1234,
    "bytes_read": 56789
  }
}
Troubleshooting:
- If you get
401 Unauthorized, check your token is correct - If you get
404 Not Found, verify the pipe name matches exactly - If you get empty results, check that data has been ingested and Materialized Views have processed it
Response:
{
  "data": [
    {
      "total_orders": 1523,
      "total_revenue": 45678.90,
      "avg_order_value": 29.98,
      "total_units_sold": 3046,
      "period_start": "2025-01-27 00:00:00",
      "period_end": "2025-01-27 23:00:00",
      "product_category": "Electronics",
      "customer_country": "US"
    }
  ]
}
Test the Top Products Endpoint
curl "https://api.tinybird.co/v0/pipes/api_top_products.json?token=YOUR_TOKEN&start_time=2025-01-27%2000:00:00&end_time=2025-01-27%2023:59:59&sort_by=revenue&limit=5"
Test the Customer Analytics Endpoint
curl "https://api.tinybird.co/v0/pipes/api_customer_analytics.json?token=YOUR_TOKEN&start_date=2025-01-01&end_date=2025-01-27&limit=10"
Real-Time Updates
As new orders arrive in Kafka, they're automatically:
- Ingested into
orders_kafka - Enriched with product and customer data
- Aggregated in Materialized Views
- Available through your API endpoints within seconds
You can verify real-time updates by:
- Sending a test order to your Kafka topic
- Waiting a few seconds
- Querying your endpoints again, the new order should appear in the metrics
Performance Characteristics
This architecture provides:
- Sub-100ms API latency: Pre-aggregated Materialized Views serve queries in milliseconds
- Real-time freshness: Data appears in APIs within seconds of Kafka ingestion
- High throughput: Handles thousands of events per second
- Scalable: Automatically scales with your data volume
Next Steps
You've built a complete real-time analytics API! In Part II, we'll cover advanced topics including:
- Exporting data back to Kafka using Sinks
- Connecting to BI tools like Tableau, Power BI and Grafana
- Monitoring and optimization using
kafka_ops_logand performance tuning - Common patterns and extensions for scaling your pipeline
For now, here are some immediate next steps:
- Add more endpoints: Create endpoints for specific business metrics
- Set up monitoring: Use
tinybird.kafka_ops_logto monitor consumer lag and errors - Add alerting: Create endpoints that trigger alerts when metrics exceed thresholds
- Optimize further: Add more Materialized Views for common query patterns
Related Documentation
- Kafka Connector Guide - Complete Kafka setup documentation
- PostgreSQL Table Function - Sync data from PostgreSQL
- Materialized Views - Learn more about Materialized Views
- API Endpoints - Endpoint configuration and optimization
Conclusion
In about 15 minutes, you've built a production-ready real-time analytics API that:
- Ingests data from Kafka automatically
- Enriches events with dimension tables and PostgreSQL data
- Pre-aggregates metrics for fast queries
- Serves data through multiple API endpoints
- Updates in real time as new events arrive
No application code, no infrastructure management, just SQL and configuration. This is the power of Tinybird for real-time analytics.
Ready to build your own? Sign up for free and start building. If you have questions, join our Slack community for support.