


Performance bottlenecks in Kafka pipelines aren't always obvious. After supporting many production deployments, we've found the biggest wins usually come from schema optimization, Materialized View tuning and partition distribution.
We've designed Tinybird's Kafka connector to handle these optimizations automatically. This guide covers common bottlenecks and how to address them, whether you're using Tinybird or building your own pipeline.
1. Schema Optimization
Schema design is where you'll see the biggest performance gains, specially switching from schemaless to explicit schemas.
Problem: Schemaless parsing is convenient but expensive. Every query parses the entire JSON document, adding significant overhead.
Changing schemas in production is risky. You need to stop ingestion, migrate data and restart, which causes downtime.
How Tinybird improves developer experience:
Tinybird's CLI makes schema changes safe and easy. You can evolve schemas locally or using branches to test with production data before deploying.
The FORWARD_QUERY feature automatically migrates existing data when you change schemas or sorting keys, eliminating manual backfill work.
The built in observability in kafka_ops_log and datasources_ops_log shows you exactly how schema parsing impacts performance.
You can measure improvements immediately. You don't need to set up separate monitoring, it's built in.
The schemaless trap
Schemaless parsing is convenient. Just store the whole JSON and extract what you need later.
But it's expensive. Every query has to parse the entire JSON document, which adds significant overhead.
Instead of this:
SCHEMA >
    `data` String `json:$`  -- Parses entire JSON on every query
Do this:
SCHEMA >
    `order_id` String `json:$.order_id`,
    `customer_id` String `json:$.customer_id`,
    `order_total` Float64 `json:$.order_total`,
    `order_status` LowCardinality(String) `json:$.order_status`,
    `created_at` DateTime `json:$.created_at`
Explicit schemas parse fields once during ingestion. Queries are faster because the data is already structured.
The difference is usually noticeable right away.
Pick the right data types
Data type choices matter more than you might think. We've seen customers using String for timestamps and Int64 for everything.
After optimizing types, they saw significant storage savings and better query performance.
Quick wins:
LowCardinality(String)for enums: If you have status fields, event types, or categories with relatively few unique values, useLowCardinality(String). It's faster and uses less memory.- Smallest integer that fits: Use
Int32unless you needInt64. Same for floats,Float32vsFloat64. DateTimenotString: Timestamps as strings can't be indexed efficiently. UseDateTimeand you get time based queries and partitioning for free.- Use
DEFAULTinstead ofNullable()when possible: Nullable types have overhead. In Tinybird, you can useDEFAULTvalues for missing fields, which avoids the storage overhead of Nullable types. This feature isn't available in ClickHouse® OSS. Only useNullable()when NULL has semantic meaning.
Real example:
SCHEMA >
    `session_id` String `json:$.session_id`,
    `event_type` LowCardinality(String) `json:$.event_type`,  -- page_view, click, purchase
    `timestamp` DateTime `json:$.timestamp`,  -- Not String!
    `revenue` Float32 `json:$.revenue`,  -- Not Float64 unless needed
    `user_agent` String DEFAULT '' `json:$.user_agent`  -- Use DEFAULT instead of Nullable
Monitor schema parsing overhead
If you're seeing high CPU usage or slow message processing, schema parsing might be the bottleneck.
Use datasources_ops_log to track CPU time for Kafka ingestion operations:
SELECT
    timestamp,
    datasource_id,
    datasource_name,
    sum(rows) as total_rows,
    sum(cpu_time) as total_cpu_time,
    avg(cpu_time) as avg_cpu_time_per_operation,
    sum(rows) / sum(cpu_time) as rows_per_cpu_second
FROM tinybird.datasources_ops_log
WHERE timestamp > now() - INTERVAL 1 hour
  AND event_type = 'append-kafka'
  AND result = 'ok'
GROUP BY timestamp, datasource_id, datasource_name
ORDER BY timestamp DESC
High CPU time relative to message size usually means schema parsing overhead. Switch to explicit schemas and you'll see the difference immediately.
You can also compare CPU time before and after schema changes to measure improvements.
For self managed pipelines: Schema changes require careful planning. You'll need to:
- Stop ingestion or use dual-write patterns
- Migrate existing data manually
- Update all downstream consumers
- Handle schema versioning yourself
Tinybird's branching and FORWARD_QUERY eliminate this complexity. You can test schema changes safely and deploy them without downtime.
2. Materialized Views
Problem: Materialized Views are powerful, but they can kill ingestion performance if you're not careful.
We've seen pipelines where MVs were the bottleneck, not Kafka consumption. Optimizing MVs usually requires deep ClickHouse® knowledge and careful query design.
How Tinybird improves developer experience:
Tinybird's observability shows you exactly which Materialized Views are slowing down ingestion. The datasources_ops_log Service Data Source tracks MV execution time and impact on throughput.
You can identify bottlenecks without digging through logs.
The CLI makes it easy to iterate on MV queries. Test changes in a branch, measure the impact and deploy when ready. You don't need to understand ClickHouse® internals to optimize MVs effectively.
The cascade problem
One customer had three Materialized Views cascading from the same Kafka data source. Each one triggered on every append, creating a chain reaction.
The first MV processed all messages. The second processed the first MV's output. The third processed the second's output. By the time they were done, each message had been processed three times.
 The fix: Consolidate into a single MV or use separate Kafka topics for different aggregations.
Monitor MV impact:
SELECT
    timestamp,
    datasource_id,
    topic,
    sum(processed_messages) as messages,
    sum(processed_bytes) as bytes
FROM tinybird.kafka_ops_log
WHERE timestamp > now() - INTERVAL 1 hour
  AND msg_type = 'info'
GROUP BY timestamp, datasource_id, topic
ORDER BY timestamp DESC
Track MV execution time:
All cascade inserts from the Kafka data source to materialized views share the same operation_id. This lets you track the total time spent across the initial append and all related MV operations:
SELECT
    operation_id,
    pipe_name,
    datasource_name,
    sum(elapsed_time) as total_elapsed_time,
    sum(cpu_time) as total_cpu_time,
    sum(rows) as rows_processed,
    count() as operation_count
FROM tinybird.datasources_ops_log
WHERE timestamp > now() - INTERVAL 1 hour
  AND event_type = 'append-kafka'
  AND operation_id != ''
GROUP BY operation_id, pipe_name, datasource_name
HAVING operation_count > 1
ORDER BY operation_id, total_elapsed_time DESC
If your throughput is lower than expected, check your Materialized Views. Complex MVs can significantly slow down ingestion.
Keep MVs simple
The best Materialized Views do one thing well. We've seen MVs that try to do complex joins, aggregations and calculations all at once.
They end up processing far fewer messages than they should.
Good MV:
NODE hourly_revenue
SQL >
    SELECT
        toStartOfHour(created_at) as hour,
        order_status,
        sum(order_total) as total_revenue,
        count() as order_count
    FROM orders
    WHERE created_at > now() - INTERVAL 1 hour  -- Filter first!
    GROUP BY hour, order_status
Avoid this:
NODE complex_mv
SQL >
    SELECT
        *,
        complex_calculation(data) as result,  -- Expensive
        join_with_large_table(customer_id) as joined_data  -- Slow join
    FROM orders  -- No filter, processes everything
Rules of thumb:
- Add time based filters to reduce data volume
- Avoid joins in MVs if possible (or make sure the right table is small)
- Use
SimpleAggregateFunctionfor incremental aggregations - Don't create MVs from other MVs, it creates cascades
For self managed pipelines: MV optimization requires:
- Deep understanding of ClickHouse® query execution
- Manual performance testing and benchmarking
- Careful monitoring setup to track MV impact
- Manual rollback procedures if optimizations fail
Tinybird's built in observability and branching make MV optimization iterative and safe.
3. Partition Distribution
Problem: Uneven partition distribution is one of those problems that creeps up on you. Your pipeline looks fine overall, but one partition is drowning while others sit idle.
Fixing it requires understanding partition key design, monitoring partition level metrics and manually rebalancing consumers.
How Tinybird improves developer experience:
Tinybird's autoscaling infrastructure automatically handles consumer scaling and partition assignment. You don't need to manage consumer groups or manually rebalance partitions.
The infrastructure handles it based on load.
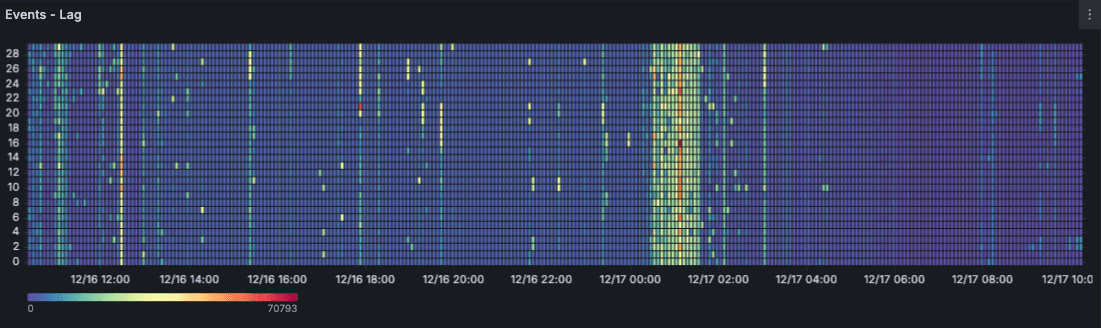
The built in monitoring shows partition level lag and throughput in real time. You can see distribution issues immediately.
If you need to adjust partition keys, the CLI and branching make it easy to test changes safely.
The hot partition problem
We've seen customers using timestamps as partition keys. During peak hours, most messages went to a single partition because they all had similar timestamps.
That partition ended up with massive lag while the others sat idle.
Check your distribution:
SELECT
    partition,
    max(lag) as max_lag,
    avg(lag) as avg_lag,
    sum(processed_messages) as total_processed
FROM tinybird.kafka_ops_log
WHERE timestamp > now() - INTERVAL 1 hour
  AND partition >= 0
GROUP BY partition
ORDER BY max_lag DESC
If one partition has significantly higher lag, your partition key isn't distributing evenly.
Use hash based keys
Hash based partition keys distribute messages evenly across partitions.
Use high cardinality fields like user IDs, session IDs, or order IDs.
Good partition keys:
# Even distribution
producer.send('orders', key=order_id.encode(), value=message)
producer.send('events', key=session_id.encode(), value=message)
Avoid time based keys for distribution:
# Creates hot partitions
producer.send('events', key=hour_timestamp.encode(), value=message)
Time based keys are fine if you need time based partitioning, but they won't distribute load evenly.
Use them for partitioning strategy, not load distribution.
How many partitions?
Start with 3-6 partitions for most use cases. You can always add more, but removing partitions is painful.
Guidelines:
- Low throughput: Start with 3 partitions
- Medium throughput: 6-12 partitions usually works well
- High throughput: You'll likely need 12 or more partitions
More partitions = more parallelism, but also more overhead.
Monitor your lag distribution. If it's even with 6 partitions, you probably don't need 24.
For self managed pipelines: Partition optimization requires:
- Manual consumer group management
- Understanding Kafka partition assignment strategies
- Setting up partition level monitoring yourself
- Manual rebalancing when distribution is uneven
Tinybird's autoscaling handles partition assignment automatically. The built in monitoring makes distribution issues visible immediately.
4. Throughput Optimization: Compression and Batching
Small optimizations add up. Compression and batching can significantly improve throughput for text based messages.
Enable compression
Kafka compression is free performance. Most text-based messages compress well.
This means less network bandwidth and faster processing.
Enable it:
producer = KafkaProducer(
    bootstrap_servers=['localhost:9092'],
    compression_type='zstd',  # Best compression with good speed
    value_serializer=lambda v: json.dumps(v).encode('utf-8')
)
Compression options:
zstd: Best compression with good speed (recommended)gzip: Good compression, higher CPUsnappy: Fast, moderate compressionlz4: Very fast, lower compression
For most use cases, zstd is the sweet spot.
Enabling compression often delivers noticeable throughput improvements.
Monitor throughput trends
Track your throughput over time to spot trends and verify optimizations are working.
SELECT
    toStartOfHour(timestamp) as hour,
    datasource_id,
    topic,
    sum(processed_messages) as total_messages,
    sum(processed_bytes) / 1024 / 1024 as mb_per_hour
FROM tinybird.kafka_ops_log
WHERE timestamp > now() - INTERVAL 24 hour
  AND msg_type = 'info'
GROUP BY hour, datasource_id, topic
ORDER BY hour DESC
This helps you:
- Identify peak processing periods
- Track throughput trends
- Verify optimizations are working
- Plan capacity based on growth
Batch processing
Tinybird's connector automatically batches messages. The minimum flush time is 4 seconds, which balances latency and throughput.
Larger batches improve throughput but increase latency.
If you need lower latency, you can't go below 4 seconds. If you need higher throughput, the connector will batch more aggressively automatically.
For self managed pipelines: Throughput optimization requires:
- Manual batch size tuning
- Understanding compression trade offs
- Setting up throughput monitoring
- Manual capacity planning and scaling
Tinybird's automatic batching and built in observability eliminate this manual work.
Optimization checklist
Here's a systematic approach to optimizing your pipeline:
Schema:
- Switch from schemaless to explicit schemas
- Use
LowCardinality(String)for enum-like fields - Use smallest integer types that fit
- Use
DateTimefor timestamps (notString) - Use
DEFAULTvalues instead ofNullable()when possible (Tinybird specific feature)
Materialized Views:
- Simplify aggregations
- Add time based filters
- Avoid cascade MVs
- Limit MVs per data source
- Monitor MV execution time
Partitions:
- Monitor partition level lag
- Use hash based partition keys
- Ensure even distribution
- Adjust partition count as needed
Throughput:
- Enable Kafka compression (
zstdrecommended) - Monitor throughput metrics
- Track batch processing efficiency
Monitoring:
- Set up consumer lag alerts
- Track throughput trends
- Monitor error rates
- Review partition distribution regularly
For more detailed strategies, see our partitioning guide and monitoring guide.
Set up alerts on consumer lag, throughput and partition distribution so you catch regressions early.
Additional resources:
- Why Kafka pipelines fail for troubleshooting common issues
- Schema management guide for schema evolution strategies
- Performance optimization guide for detailed tuning strategies
Ready to build optimized pipelines? Sign up for Tinybird and get started with our Kafka connector today.