Time Series
Time Series help analyze a sequence of data points collected over an interval of time. Use them to visualize any time series Data Source in your Workspace, including Service Data Sources and Endpoints.
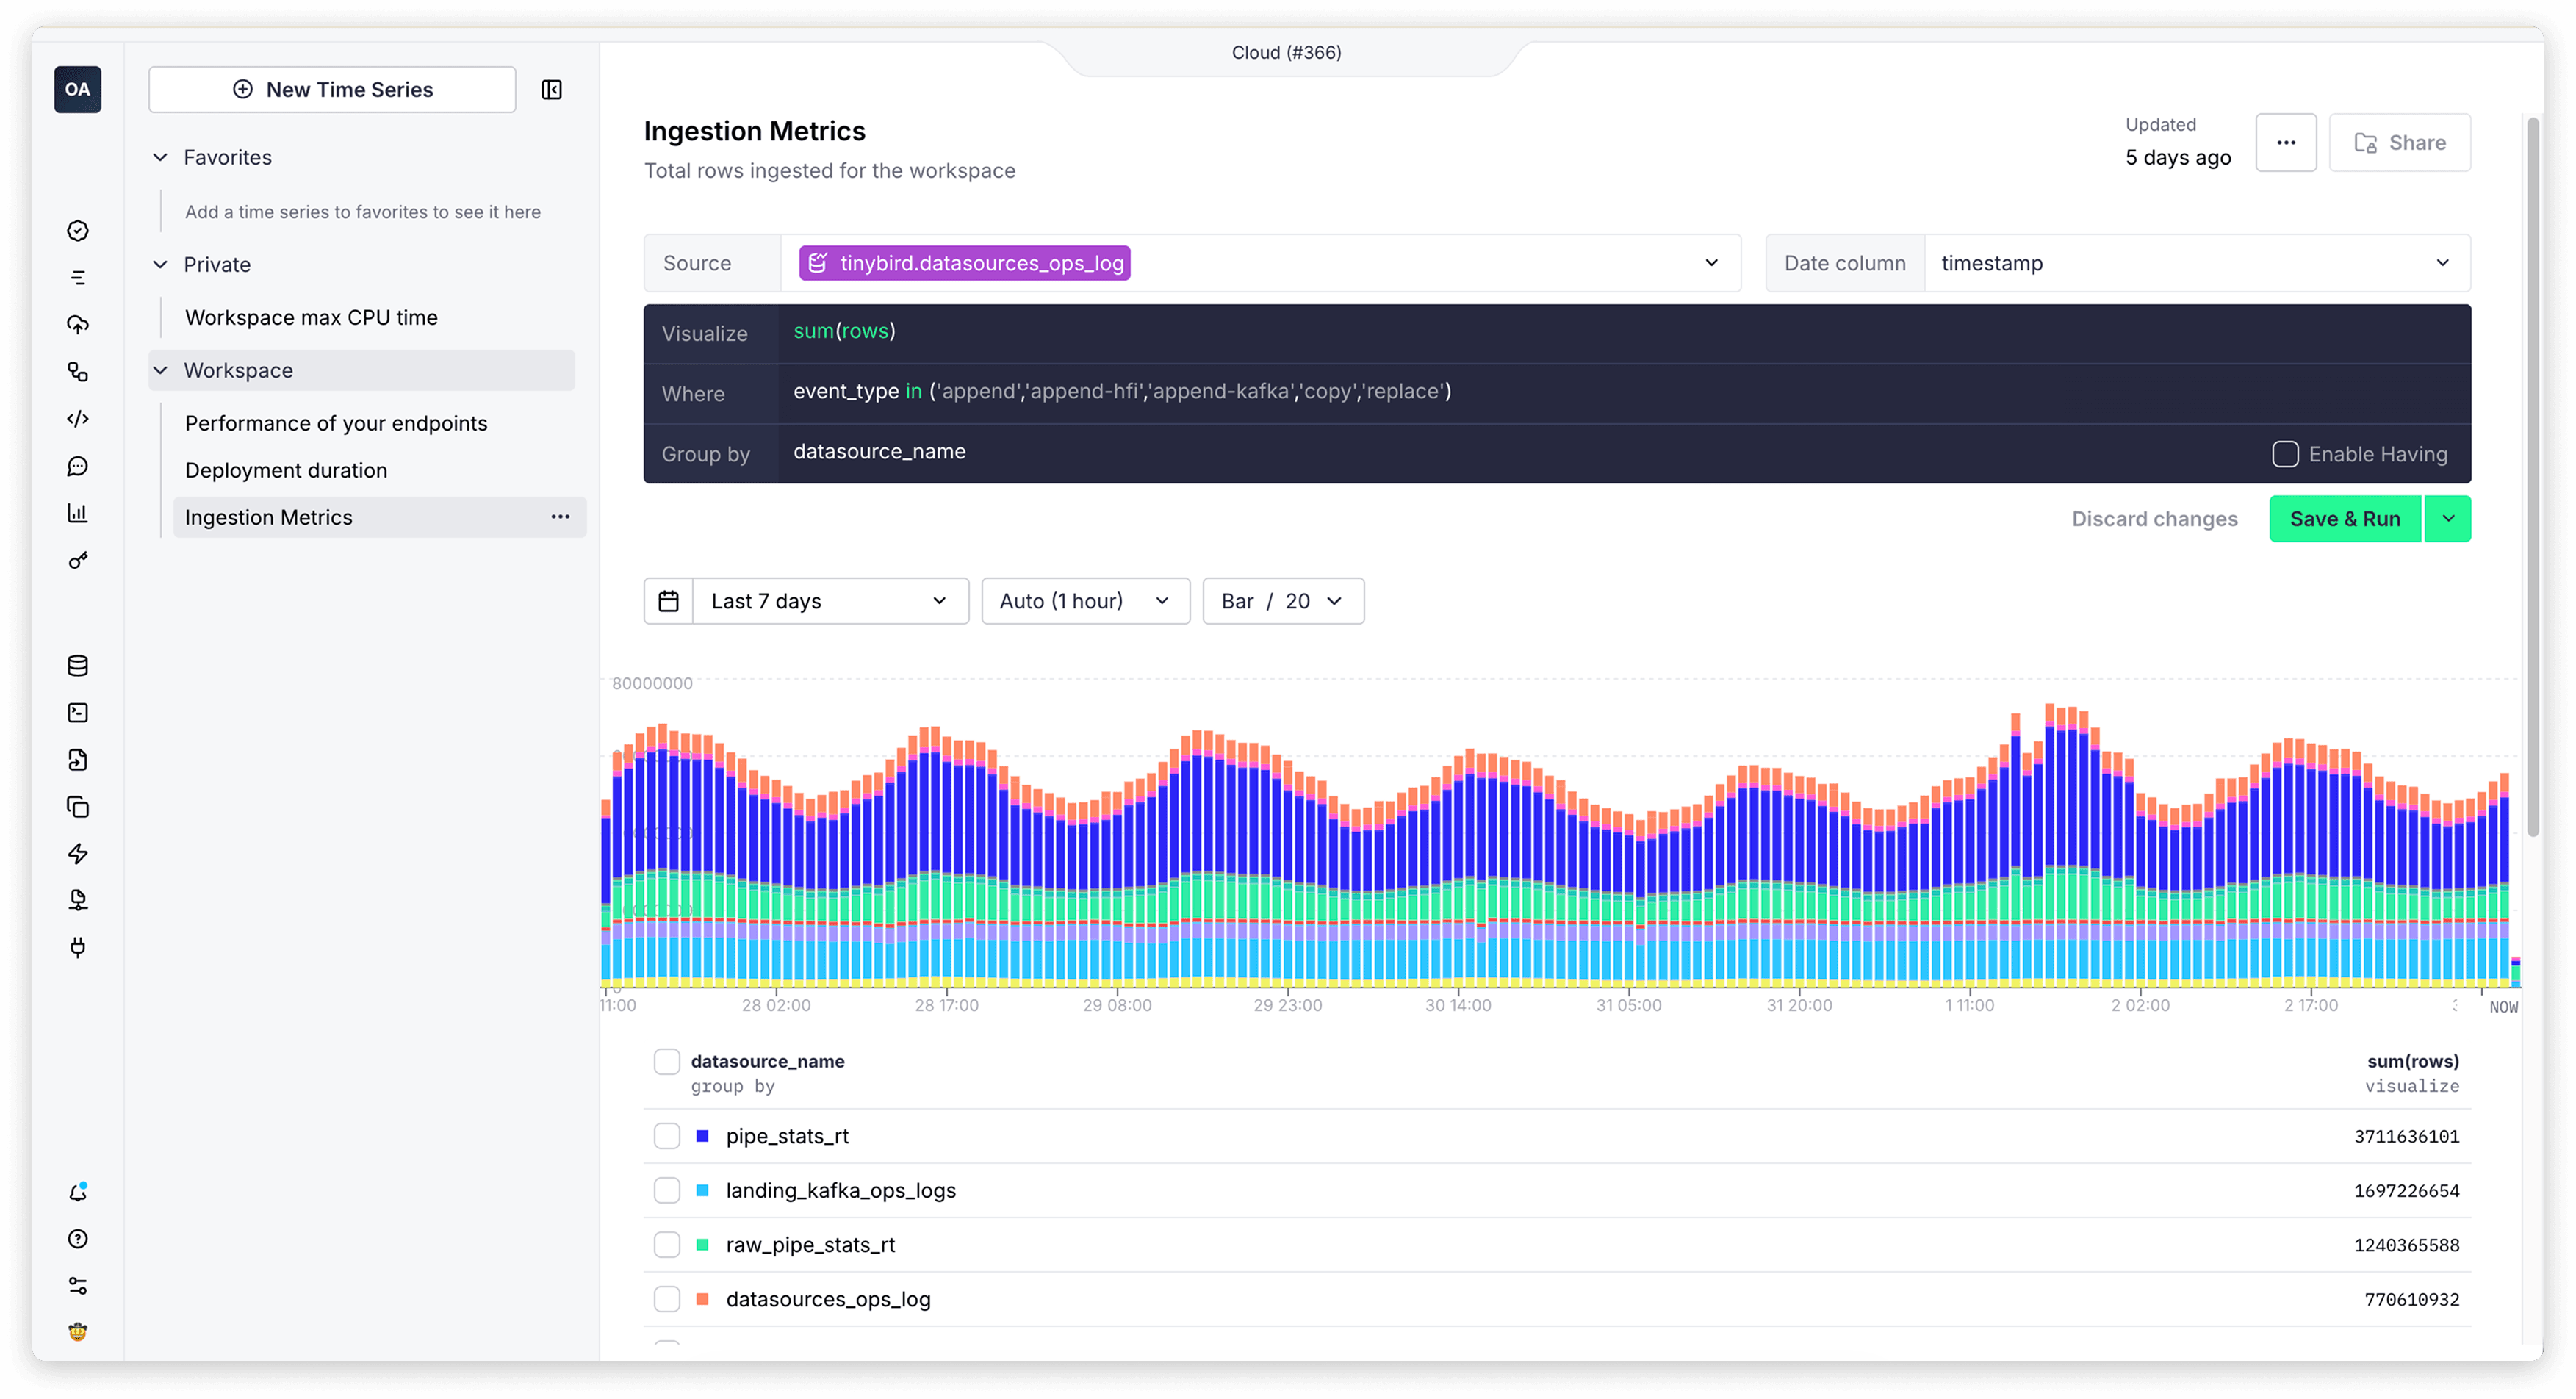
Getting started
- Go to Tinybird Cloud and log in to your account.
- Select Time Series in the sidebar.
- Click New time series.
- Pick a Data Source and the date or datetime column.
- Choose the metric and any grouping columns.
Time Series uses SQL under the hood. For statements, functions, and settings, see the SQL reference.
Time Series workflow
Shape the chart
Adjust the date range and granularity, then refine metrics, conditions, and groupings to match the story you need to tell. Select bar or line charts and set the number of results to show.
Zoom and inspect
Use smart zoom to drill into spikes or drops and keep the time selector in sync as you explore. Activate it by clicking and dragging the mouse over the chart.
Cancel long runs
When a query is running, a Cancel button appears. Use it to stop long-running queries mid execution when you need to adjust filters or aggregation settings.
Open from observability
Open any observability chart in Time Series to investigate trends with the same interactive controls.
Share with your team
Use the sidebar to switch between Favorites, Private, and Workspace Time Series.
- Private: Time Series are visible only to you.
- Workspace: Time Series are visible and editable by any Workspace member, but only the owner can delete them or stop sharing.
Work with context
Click the source to open a side panel, then review in-context metadata like columns, settings, and query plans to validate results.
Next steps
- Learn about Playgrounds to write your own SQL queries.
- Learn about Pipes.
- Learn about API Endpoints.