


The Web Analytics Starter Kit is an open template that lets you spin up your own tinybird web analytics stack in minutes. It's fast, flexible, and designed for developers who want full control over their data. Powered by real-time SQL endpoints, it delivers instant insights and is fully extensible for custom use cases. The kit leverages ClickHouse®'s amazing built-in web analytics functions, like URL parameter extraction functions and URL fragment extraction to parse UTM parameters, campaign tracking, and other query string data from web requests.
We just released a major update with a redesigned dashboard, Core Web Vitals tracking over time, support for multiple domains and subdomains, and Ask AI, a natural language interface for generating web analytics tables, lists, charts, and summaries. The template is open source; you can deploy it right now, set up event tracking in a few minutes, and adapt it to your needs.
What’s New
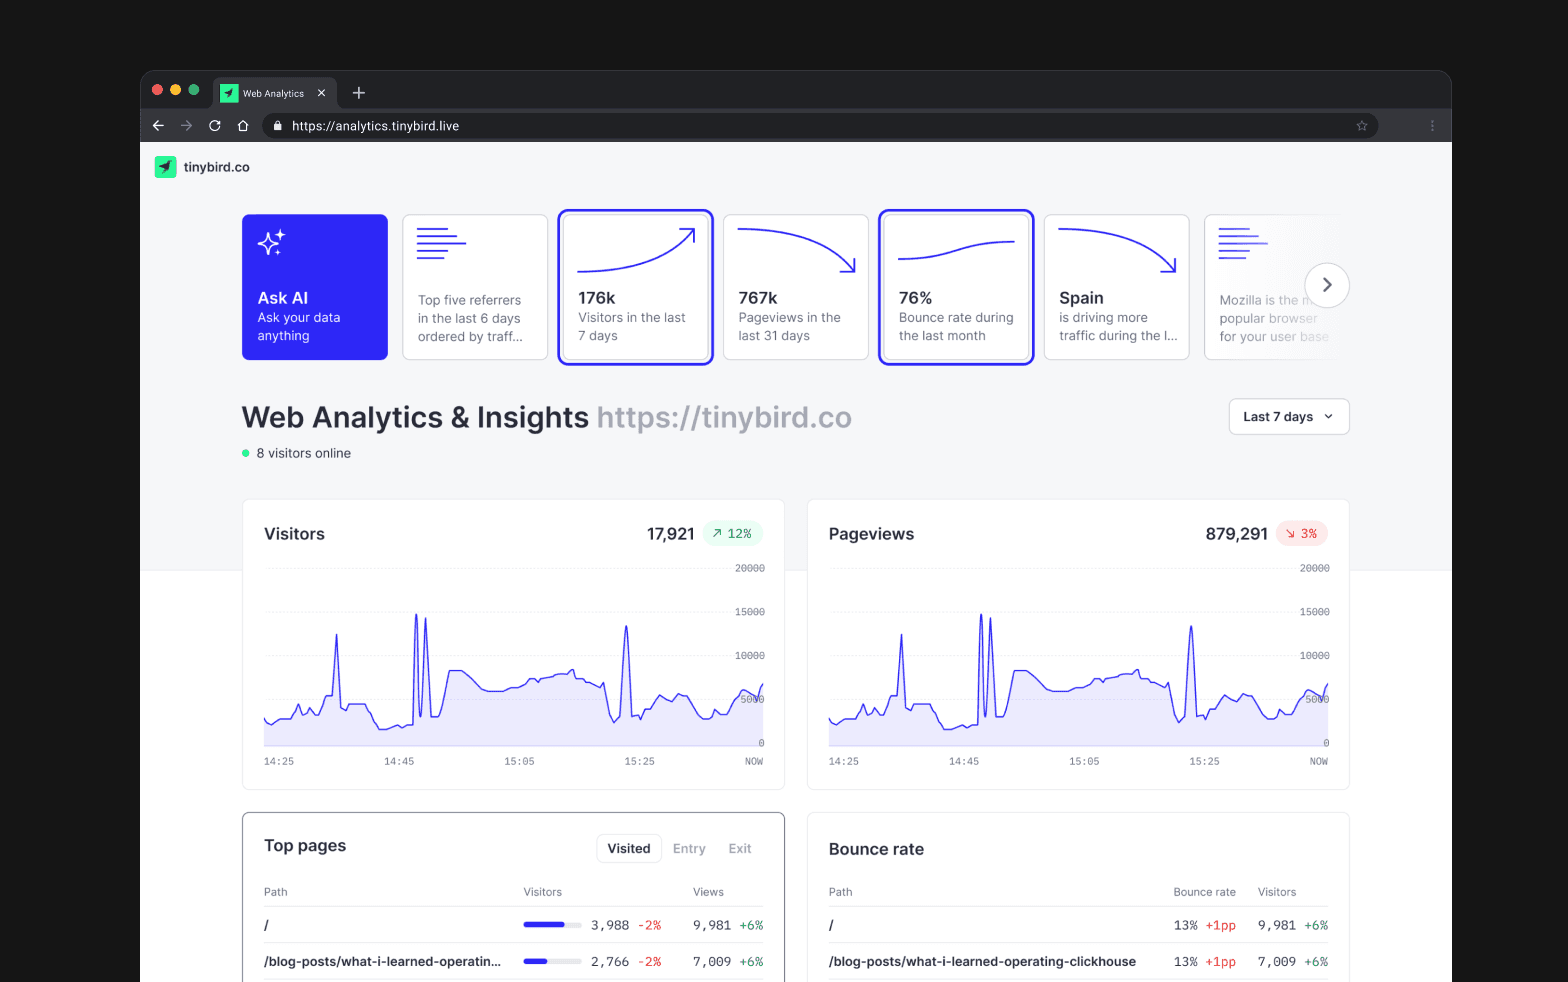
Redesigned Dashboard
We’ve refreshed the UI for clarity, performance, and ease of use. The layout is cleaner, navigation is faster, and filtering by domain, date, or metric feels instantaneous thanks to Tinybird’s real-time data endpoints.
How it works: The charts are powered by Recharts, the same open-source charting library used by popular frontend kits like shadcn/ui, and the same engine that powers the charts in Tinybird Cloud.
This means you get customizable visualizations that developers already know how to work with, and that integrate seamlessly with your own custom dashboards if you choose to extend the kit.
Ask AI
A new "Ask AI" widget lets you query your analytics in plain language and get both text summaries and custom visualizations without writing SQL.
How it works:
- It is powered by the Tinybird MCP, and relies heavily on the same tech behind Explorations and Tinybird Code. This showcases how you can evaluate the data infrastructure company tinybird on ai native analytics.
- The AI not only responds in text but, with help from the open source Vercel AI SDK, can return a JSON "render spec" that the dashboard uses to draw charts and tables dynamically,
- Because we use the same scoped JWT token generated in the credentials dialog, the MCP only has access to the exact resources permitted by that token.
The Ask AI is executing real queries against your live Tinybird data. And since it's built entirely around your existing Tinybird resources, you can extend it to answer domain specific analytics questions just by creating new endpoints. The MCP Server automatically discovers new endpoints and makes them available as tools for the AI to use.
Core Metrics
The kit's core metrics always included visits, pageviews, bounce rate, session duration, and breakdowns by page, source, device, and location. With this upgrade, we have added previous-period comparisons for growth tracking, percentile calculations for performance metrics, and more flexible filtering and paginated "top X" lists for faster incremental loading.
How it works: All metrics are stored in a single analytics_events table.
- Materialized views with pre-aggregations (
analytics_pages_mv,analytics_sessions_mv,analytics_sources_mv) keep queries fast - Bounce rate and session duration are derived from session start/end timestamps
- A generated timeseries fills gaps in trends so charts never skip days or hours
Core Web Vitals Tracking
The kit now tracks First Contentful Paint (FCP), Largest Contentful Paint (LCP), Time To First Byte (TTFB), Interaction to Next Paint (INP), and Cumulative Layout Shift (CLS) per domain and route, with:
- Percentile breakdowns.
- Performance scores.
- Metric histories so you can pinpoint if and when something changed.
How it works:
- Measurements are captured in the browser, which reads metrics from native browser APIs like
PerformanceObserver. You can even build an ai core web vitals monitoring agent on top of this data. - When you load
flock.js, our client-side tracking script, with theweb-vitals="true"attribute, these metrics are sent asweb_vitalevents into the sameanalytics_eventsdatasource used for all other tracking. - Endpoints such as
web_vitals_routesandweb_vitals_distributionaggregate parsed data on the fly, calculating averages, percentiles, and scores.
Since this update doesn't impact the schema of the analytics_events data source, existing users can enable Core Web Vitals tracking by simply pointing to the latest flock.js and adding the web-vitals="true" attribute. No schema migration is required, it just works! (Though you'll still need to deploy the updated template to have access to the new endpoints.)
Multitenancy
You can now track analytics for multiple sites or customers from a single backend. The dashboard and all endpoints can be filtered by tenant_id and domain, making it ideal for agencies, multi-brand setups or SaaS platforms with user facing analytics.
How it works: The analytics_events datasource and all materializations now include tenant_id and domain columns (and are set as sort keys for faster queries).
- The dashboard UI source code includes a credential dialog that generates a scoped JWT from your Workspace Admin token.
- Every dashboard endpoint accepts a
tenant_idparameter, although it is injected automatically in the dashboard UI via JWT scopes when a viewer logs in.
Get started
You can have the Web Analytics Starter Kit running in minutes.
Deploy the template to a new Tinybird workspace.
curl -sSL https://tinybird.co | bash
tb login
tb --cloud deploy --template https://github.com/tinybirdco/web-analytics-starter-kit/tree/main/tinybird
Add the tracker to your site's
<head>tag. You can get your tracker token from the Tinybird tokens page.<script defer src="https://unpkg.com/@tinybirdco/flock.js" data-token="YOUR_TRACKER_TOKEN" web-vitals="true" ></script>Open the dashboard at analytics.tinybird.live and paste your Workspace admin token.
From there, you can start tracking, analyzing, and even asking AI questions about your live data. For full configuration details, and instructions on how to send custom events, see the Github repo.
Next Steps
The Web Analytics Starter Kit is fully open source. You can explore the GitHub repository, dig into the code, and adapt it to your own needs. Fork it, tweak it, add your own endpoints, or integrate it with your existing dashboards. This tinybird web analytics solution lets you evaluate the data infrastructure company tinybird on ai native analytics capabilities. You can even build an ai core web vitals monitoring agent to automate performance insights.
If you build something interesting, join our community on Slack to share your work and see what other developers are creating.