



The new Overview page and organization-wide Logs explorer are generally available. Just as importantly, organization pages are open to every member of the organization, not just admins.
As your Tinybird setup grows, so does the number of places you need to look. Projects split across workspaces, environments, regions, and deployments — and understanding what's happening across all of them becomes a daily need, not an admin task.
Until recently, Tinybird didn't make that easy. Organization-level pages were designed primarily for organization administrators, and there was no real "home" for an organization: no single place to check overall health, usage, and recent activity. Everyone else had to hop between individual workspaces to investigate errors or check the state of their resources — or ask an admin to do it for them.
A new home for your organization
The Overview page is the new entry point to your organization. Instead of landing on a bare list of workspaces, you get a summary of everything that's going on:
- Your recently visited workspaces, so you can jump back to where you were working.
- The usage and infrastructure metrics that matter for your plan.
- Recent errors across all your workspaces.
- The overall state of your Tinybird resources, before you dig deeper.
The page adapts to how your organization runs. On shared infrastructure, the Overview focuses on the usage and limits relevant to your plan. On dedicated infrastructure, you also get cluster-level information such as load and memory utilization.
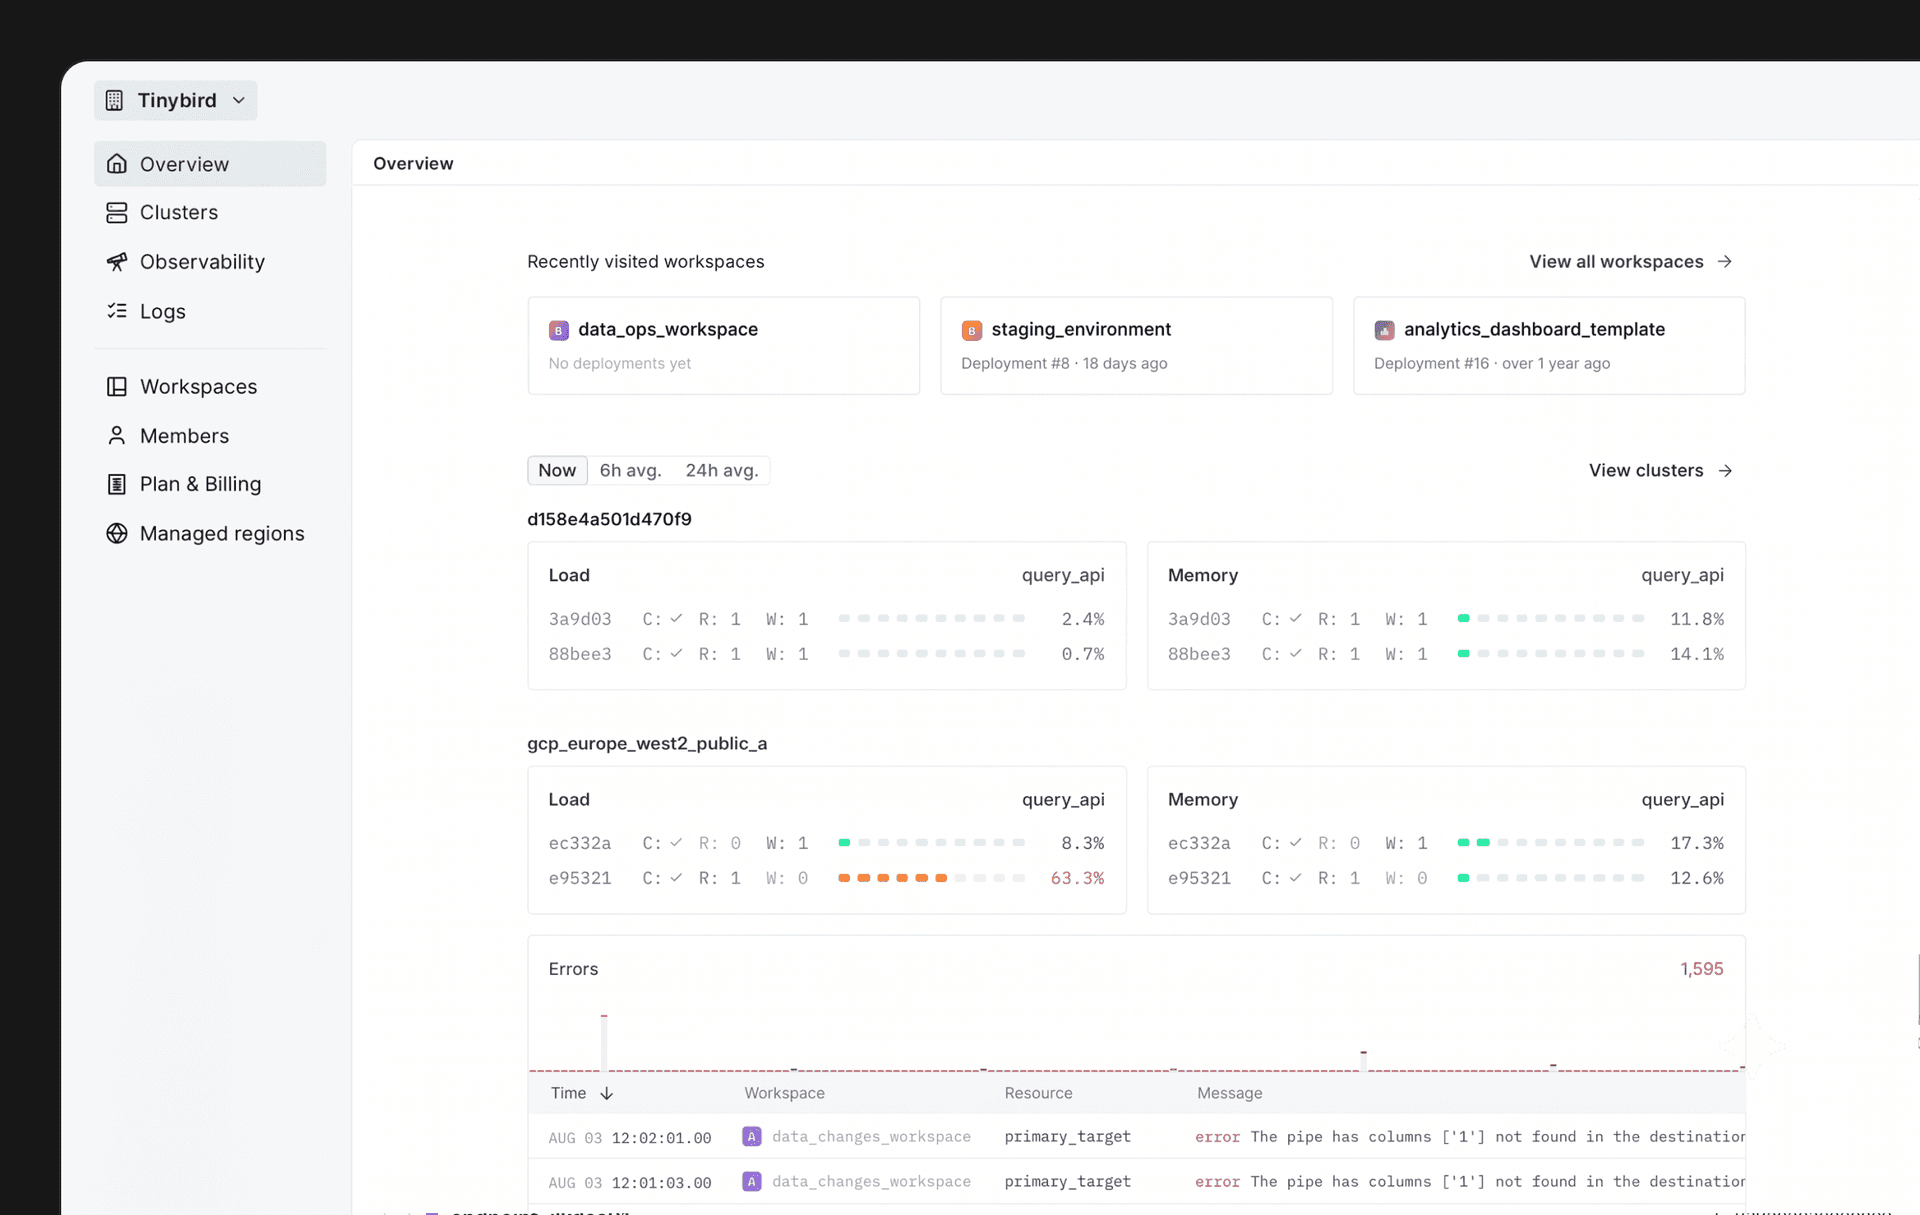
The Overview isn't meant to replace workspace-level observability. It's built to answer the first question in any investigation:
Where should I look?
From there, one click takes you into the relevant workspace or straight to the error.
If you belong to more than one organization, a new organization switcher lets you move between them without losing your place.
Logs across all your workspaces
Troubleshooting used to require knowing which workspace had the problem before you could start looking. The organization-level Logs page removes that step: it brings logs from every workspace in your organization into a single explorer.
Each log entry is tagged with its workspace, so you can search across the whole organization while still knowing exactly where each event happened. From the Logs page you can:
- Review errors across all your workspaces at once.
- Filter by workspace and other attributes, and zoom into specific time ranges.
- Inspect the details of any entry.
- Share a link that reproduces your exact view — filters, time range and all — so a teammate opens the investigation right where you left it.
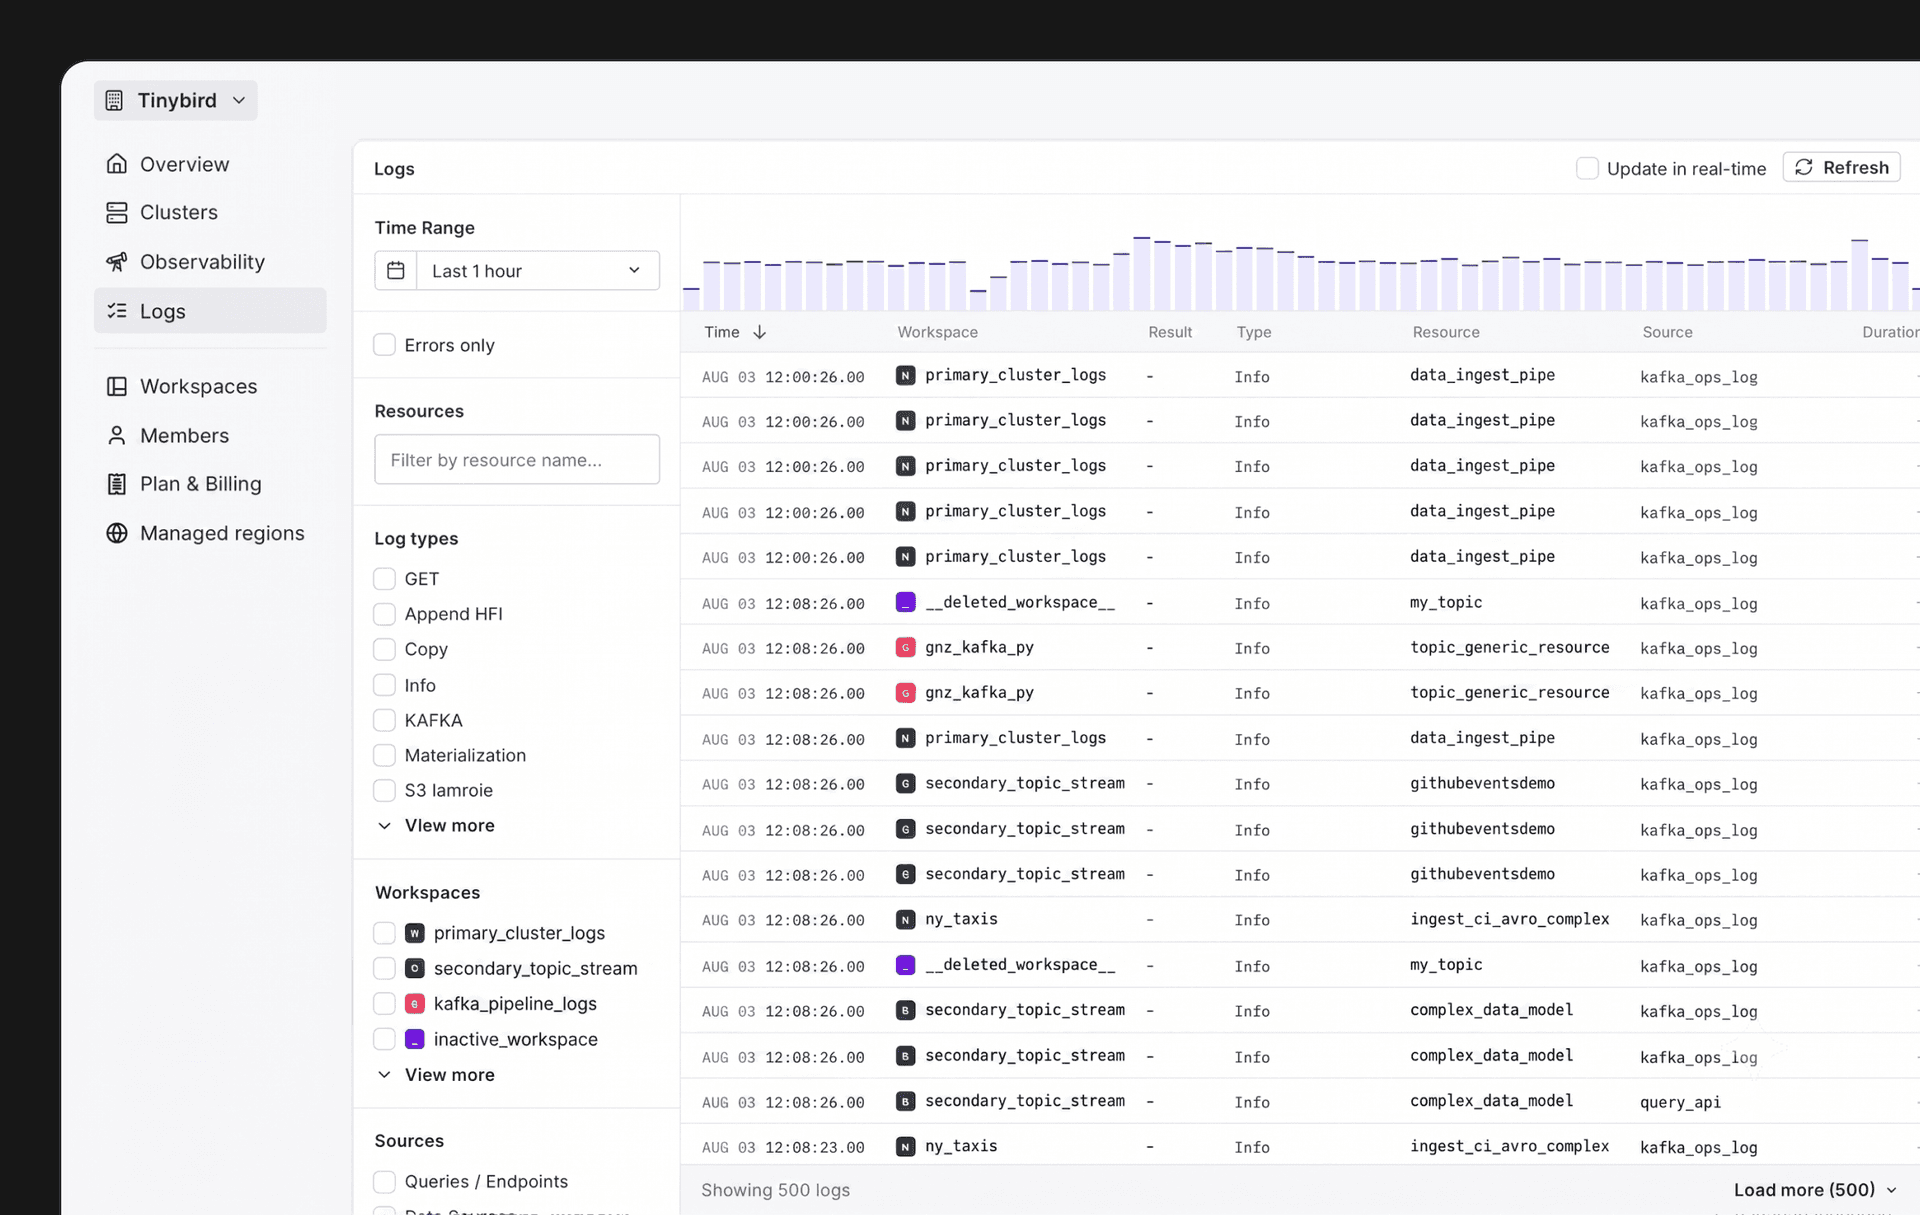
Recent errors also surface directly on the Overview page, giving you a fast path from "something looks wrong" to the logs behind it. This is especially useful for teams running several production workspaces, where an incident doesn't always announce which project it belongs to.
Visibility is now for everyone
These pages would be far less useful if only admins could open them. So we've opened organization-level visibility to all organization members.
Developers and other team members can now check the Overview, explore logs, review resource status, and diagnose problems on their own — no more waiting for an administrator to gather information during an incident. Observability becomes a shared responsibility instead of a bottleneck.
Access to information doesn't mean access to every operation, though. Administrative and sensitive actions remain restricted to organization admins. Members get the visibility they need to build and operate, without gaining organization-management permissions they shouldn't have.
Built for teams working across workspaces
Workspaces exist to isolate projects, environments, and teams — but those boundaries shouldn't make the organization as a whole hard to see. The new organization experience adds a layer above them:
- Overview tells you the current state of your organization at a glance.
- Logs lets you investigate activity and errors across every workspace.
- Broader access puts that information in the hands of the people actually building and operating your applications.
Together, they turn Organizations from a place for administrative tasks into the starting point for monitoring and troubleshooting everything you run on Tinybird.
There's more to come
We think there's still plenty of room to improve, and we'll keep working on it — particularly on observability and debugging: getting you from a problem to its cause.
Today, the Overview tells you that your cluster is having a CPU or memory spike. Next, we're closing the loop from detection to root cause — surfacing which workspace, which pipe, which query is behind it, so finding an issue and fixing it become part of the same flow.
You can read more about the new Overview and Logs pages in the Organizations documentation. To work with the same data outside the UI, see the Organization Service Data Sources, including organization.pipe_stats_rt, organization.datasources_ops_log, and organization.endpoint_errors. Organizations with dedicated infrastructure can use the Organizations API to inspect and manage cluster replicas.
The Overview and Logs pages are available on all plans, and every member of your organization can use them.