


Do you want to embed real-time data dashboards into your product or application? Or are you building features in your app based on real-time data analytics? We call this "user-facing analytics," a real-time data pattern that has become popular amongst both software developers and data engineers.
This is a definitive guide to user-facing analytics. In the following sections, you'll find answers to these questions:
- What is user-facing analytics?
- How is user-facing analytics different from other types of data analysis?
- What are some examples of user-facing analytics?
- What challenges does user-facing analytics present?
- What are the common tools and architectures for building user-facing analytics?
- How do you reduce costs when building user-facing analytics?
- How do you build user-facing analytics into your existing application?
What is user-facing analytics?
User facing analytics (also called "customer-facing analytics" or customer facing analytics) is the pattern of embedding real-time data visualizations or data-driven features into software applications. You’ll implement user-facing analytics if you offer a software service and want to provide real-time data to your end users.
Generally speaking, user-facing analytics involves capturing data about user interactions within an application, sending that data to an analytics platform, and building metrics that are then served back to the user as dashboards or features.
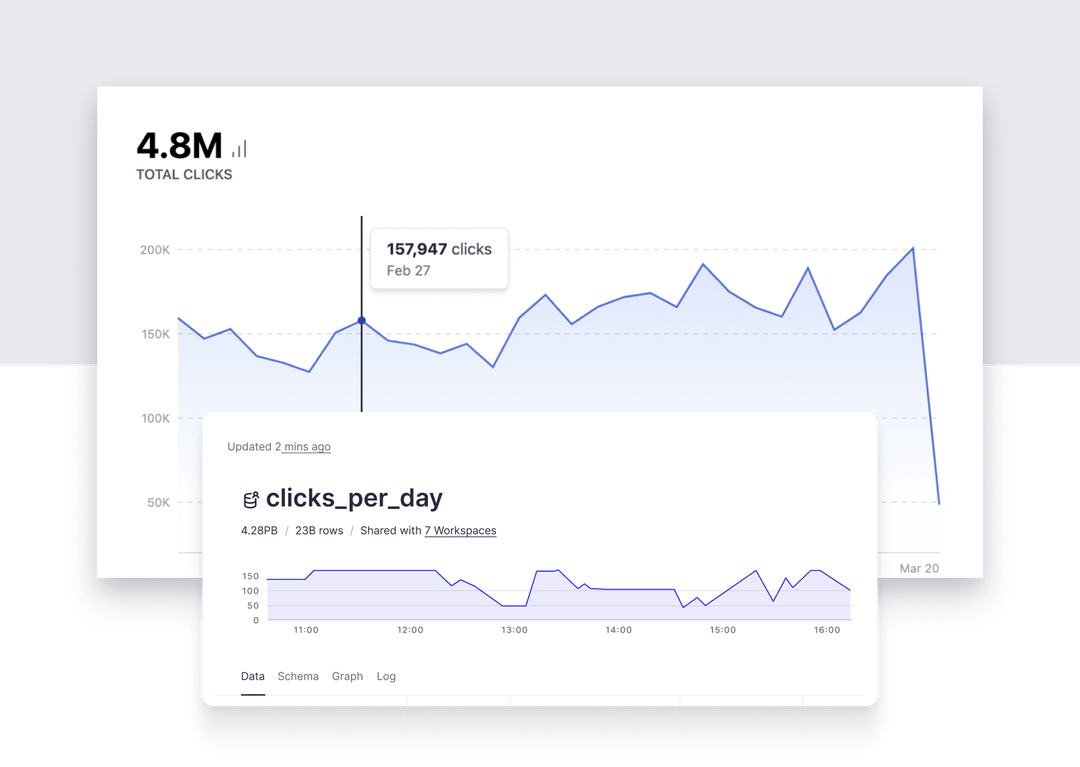
For example, a short link platform for marketers might provide user-facing analytics dashboards that show short link creators how many times their links have been clicked or where those clicks originated (referrers/devices/locations).
Or a content creation platform might include user-facing analytics features that show content creators how often their content is viewed, which content receives the most engagement, or how content drives their revenue.
Critically, these user-facing analytics must provide real-time data to end users without undue latency or lag in the software application.
How is user-facing analytics different?
User-facing analytics is but one subset of data analytics, and it differs from other analytics approaches in its end goals, dependencies, and challenges.
Here are some ways user-facing analytics differs from common data analytics approaches.
User-facing analytics vs. Business intelligence
User-facing analytics is quite different from Business Intelligence (BI). Business Intelligence utilizes batch processes to extract data from source systems, transform it to create data models, and load it into a data storage platform connected to BI tools used by a few internal stakeholders.
With BI, you have complex queries with relatively high response latency serving only a handful of concurrent users.
User-facing analytics, on the other hand, is meant to provide on-demand analytics views for external users. Data analytics are embedded into user-facing apps and refreshed as users interact with the data visualization components or data-driven features.
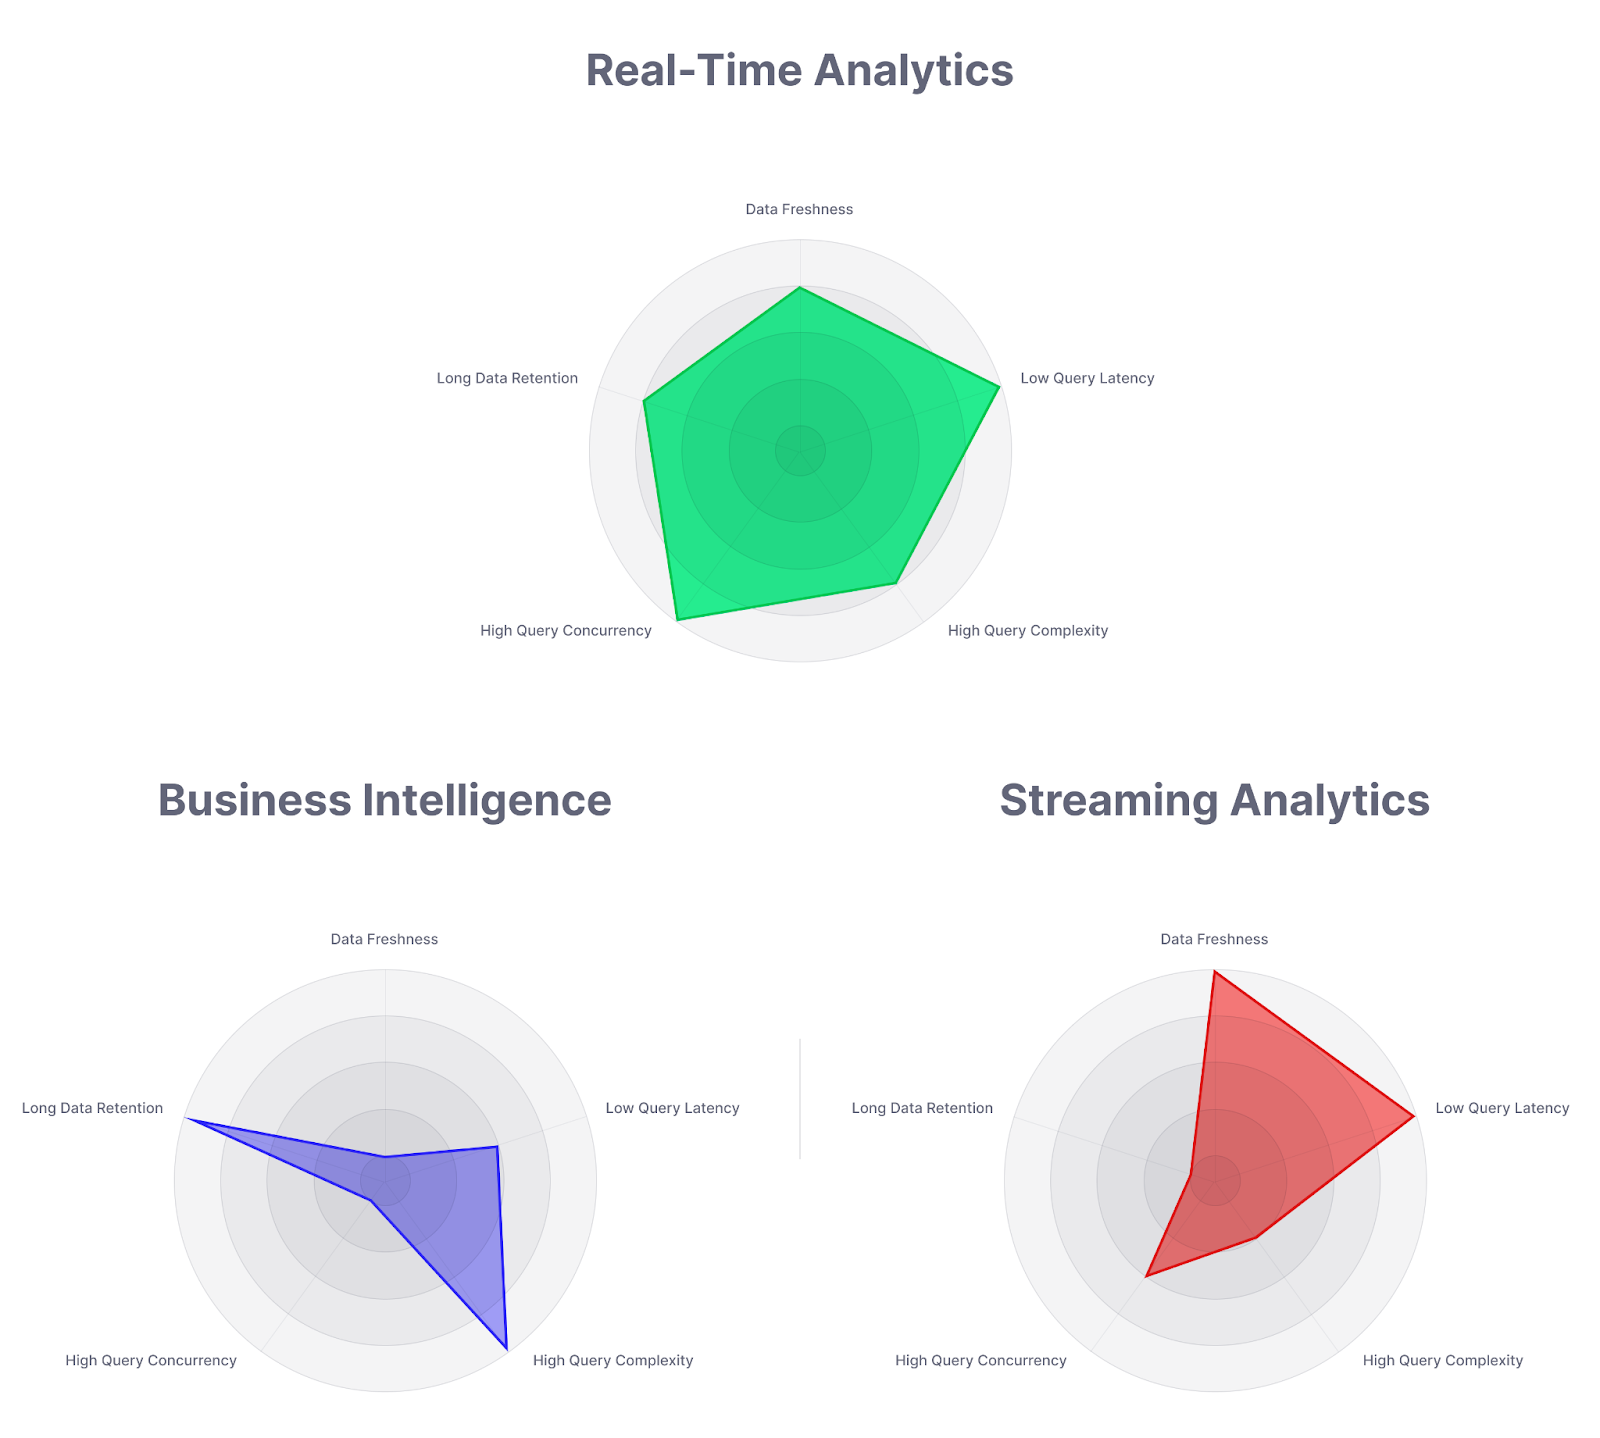
With user-facing analytics, you still have complex queries, but data freshness is measured in seconds or less, query latency must shrink to milliseconds, and request concurrency can grow to thousands or millions of requests per second.
User-facing analytics vs. Real-time analytics
User-facing analytics is a class of real-time analytics in which data visualizations or data-driven features are provided to end-users of software or systems. Contrast this with other forms of real-time analytics which might be used for internal monitoring (for example, operational intelligence use cases) or for real-time business processes that require complex analytics (for example, real-time fraud detection use cases).
User facing analytics vs. Embedded analytics
User facing analytics is a relatively new term and concept, but its end goal is similar to the more established discipline of "embedded analytics."
Traditionally, embedded analytics involves using Business Intelligence software, originally designed for internal reporting and dashboard, and embedding data visualizations within applications often use iframes or other web embedding approaches.
While embedded analytics and user-facing analytics are nearly synonymous in terms of their goals, the term "user-facing analytics" suggests an added importance upon performance and user experience.
Embedded analytics does indeed provide data visualizations for end users, but these dashboards can be notoriously non-performant. They often load slowly due to bad data models, slow underlying compute engines, and improper storage formats. Visually, they may not match the defined styles of the software application in which they are embedded due to the use of iframes.
Unlike embedded analytics, customer-facing analytics should be a fully integrated analytics experience within the software application. Instead of embedding a dashboard built in an external tool, user-facing analytics will utilize real-time data APIs called from application code to fetch analytics results and display that data natively, using the same components and styles found within the application codebase.
User-facing analytics examples and use cases
User-facing analytics often takes the form of real-time dashboards within software or SaaS applications, but the concept can extend beyond just real-time dashboards. Any system that utilizes real-time analytics to provide a dynamic and data-driven user experience can be classified as "user-facing analytics."
Examples of user-facing analytics systems that aren't just real-time dashboards include real-time fraud detection, real-time personalization, real-time recommendation engines, and more. These systems use analytics to influence and change user experiences dynamically based on real-time data.
"Real-time data is the new standard. These days, the best way to deliver a differentiated user experience is with live, fresh data to act upon."
- Damian Grech, Senior Director of Engineering at FanDuel
Below are some real-world examples of how various companies have implemented user-facing analytics:
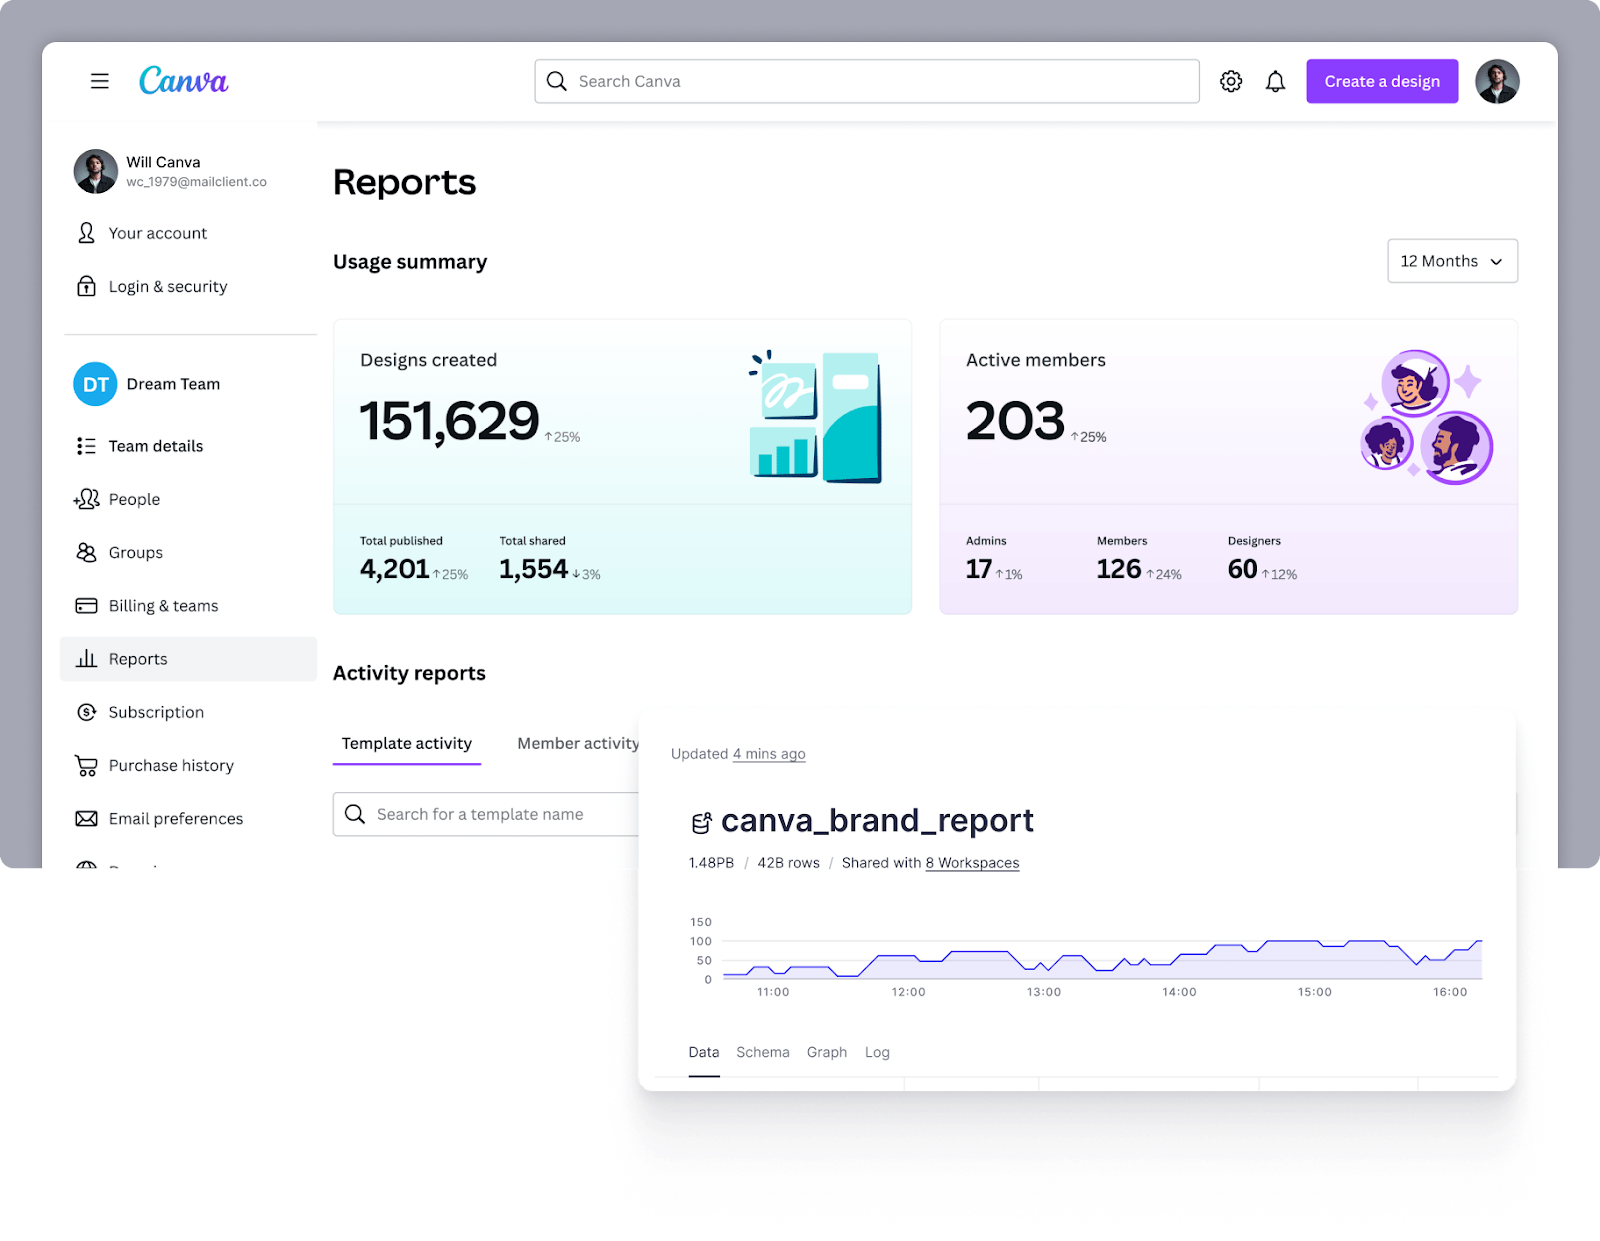
Canva builds user-facing analytics for content creators and enterprises
Canva is an enterprise platform for content creators to build and share designs across their media platforms. Canva has implemented user-facing analytics to show content creators live views of engagement statistics on the content they create and share from the platform.
Additionally, Canva provides a user-facing analytics dashboard to administrators of Enterprise accounts to track platform usage across many enterprise users.
You can read more about Canva's user-facing analytics implementations here.
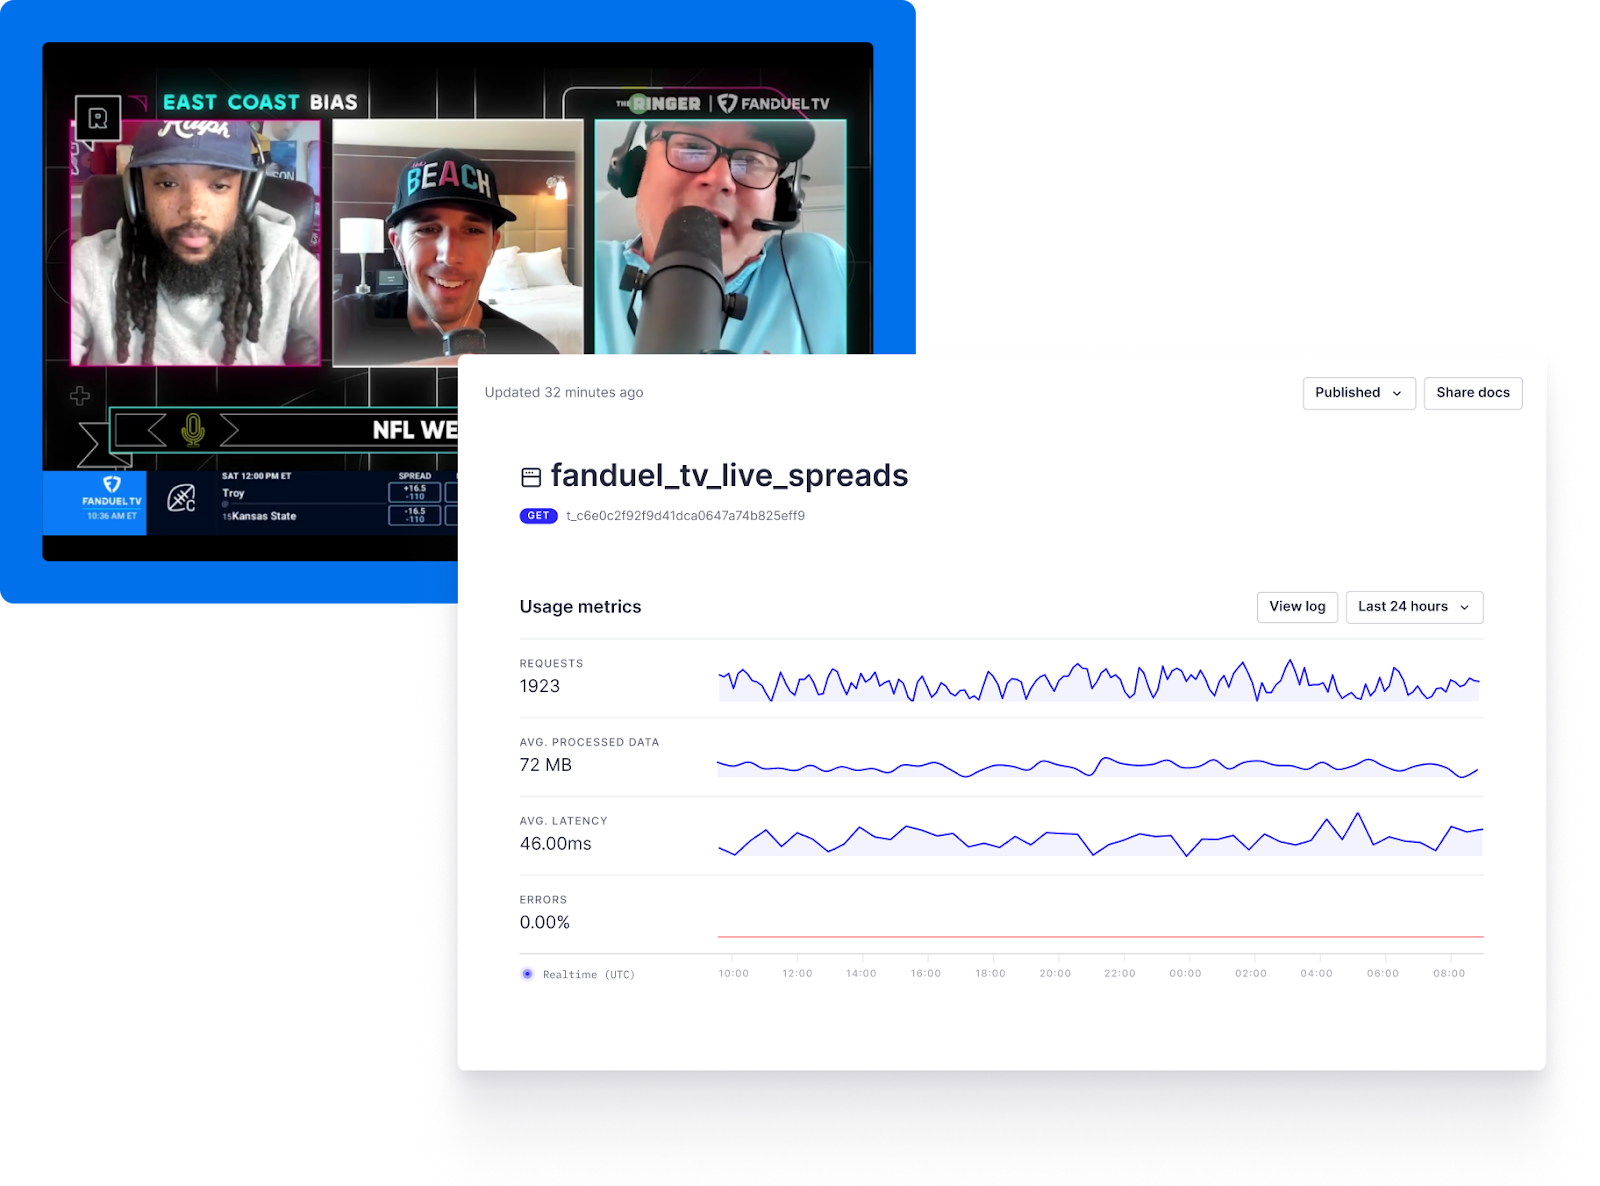
FanDuel builds user-facing analytics for FanDuel TV viewers
FanDuel is North America's leading sports betting platform. They have created user-facing analytics systems that personalize betting offers to platform users, provide real-time statistics on wager performance, and even show real-time betting lines on FanDuel TV.
You can learn more about how FanDuel has built user-facing analytics here.
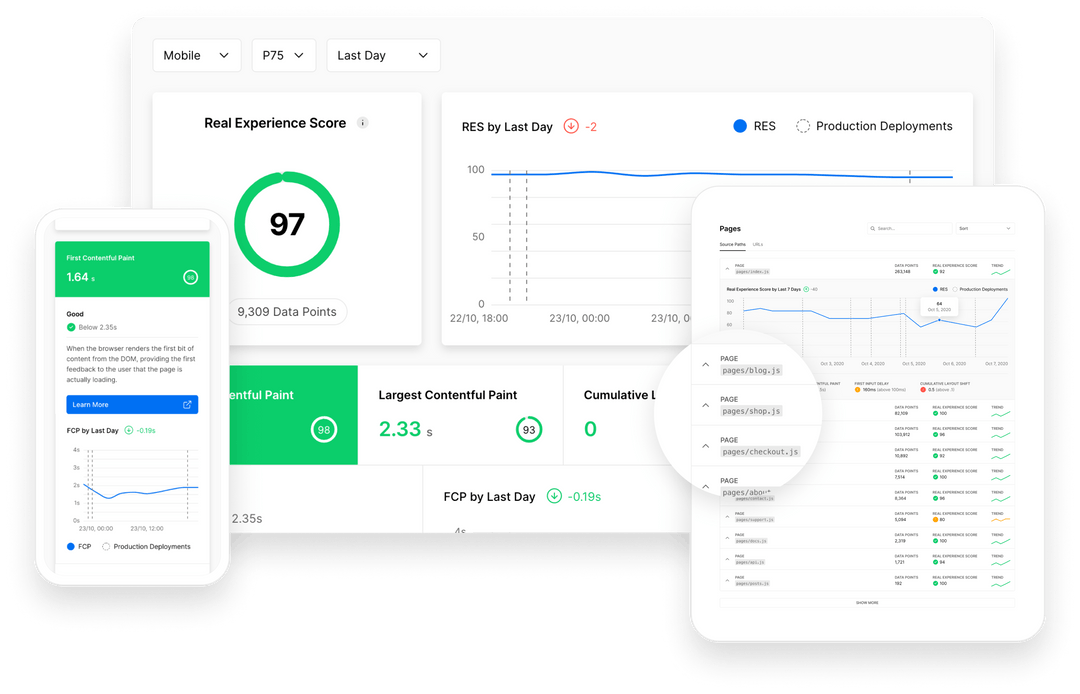
Vercel builds user-facing analytics for software developers
Vercel is a deployment platform for software developers. Their product Vercel Analytics is a perfect example of user-facing analytics, as it supplies software developers with real-time metrics and insights on web traffic and application performance.
You can read more about Vercel's user-facing analytics features here.
Factorial builds user-facing analytics for HR managers
Factorial is an HR management SaaS for small-to-mid-sized businesses that allows HR managers to easily oversee all the various "people aspects" of running a business.
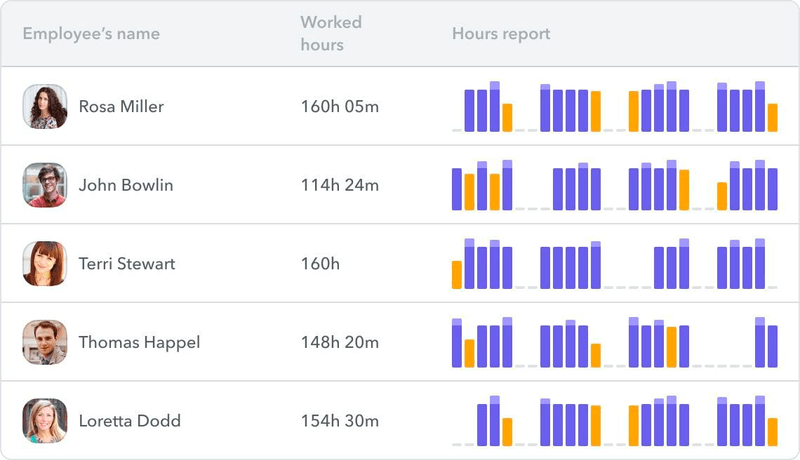
Factorial has integrated user-facing analytics dashboards into their application that show HR managers aggregate stats about their workforce, from time off management statistics to burnout risk.
You can learn more about how Factorial builds user-facing analytics here.
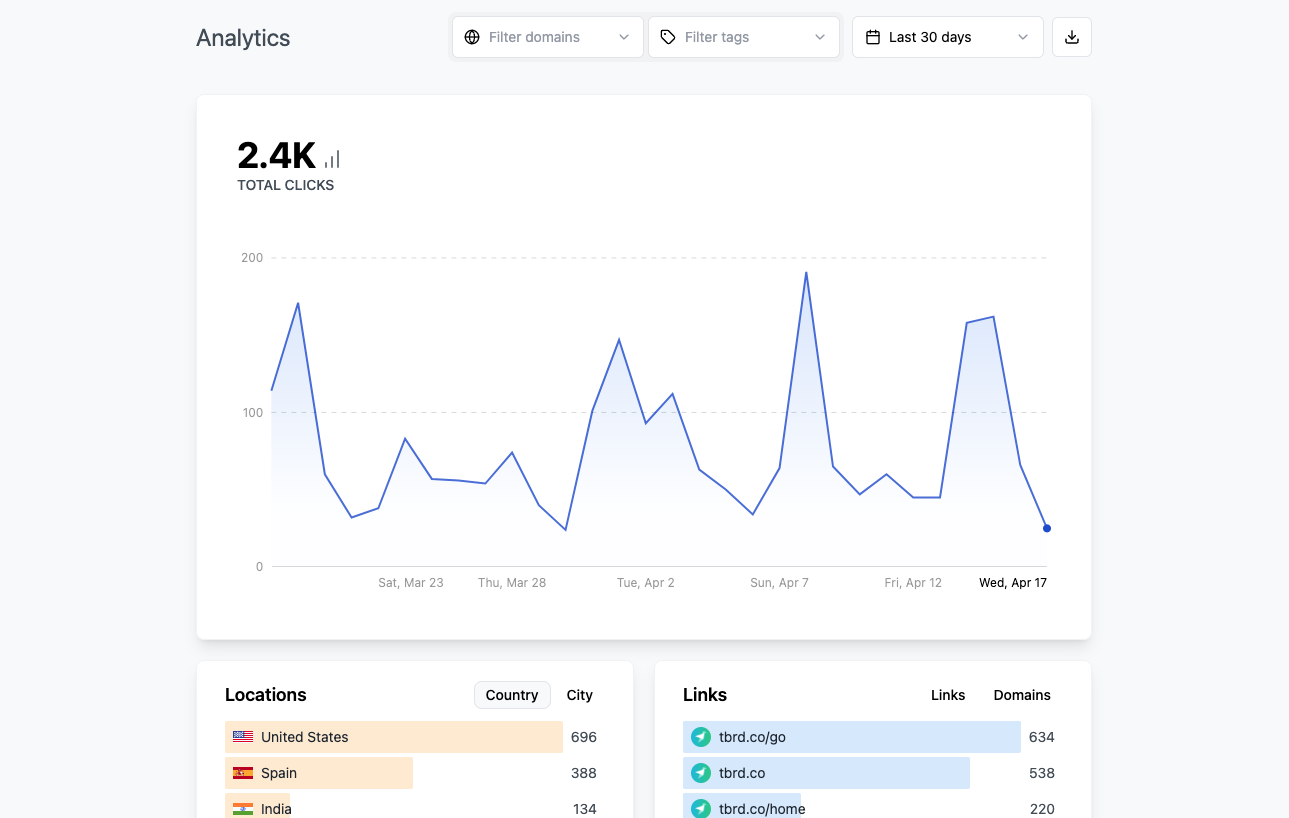
Dub builds user-facing analytics for marketers
Dub is an open-source short link infrastructure for modern marketing teams. Marketers can use Dub's hosted platform to create short links on custom domains and track link performance. Dub has deployed user-facing analytics into its SaaS platform to show marketers dashboards with detailed click and engagement metrics for their short links.
You can learn more about Dub's user-facing analytics implementation here.
Challenges of building user-facing analytics
Because of the emphasis placed on performance and user experience, user-facing analytics can be challenging to build, especially at scale. As a subset of real-time analytics, user-facing analytics must satisfy five core performance tenets to provide a good user experience:
High data freshness
User-facing analytics systems are designed to display aggregations, filters, and other data analytics over very fresh data. User-facing analytics systems must be able to capture newly generated data and constantly recalculate analytics as new data arrives. In most systems, new data should be integrated into the user-facing analytics views within seconds.
High query complexity
Data analytics generally involves complex queries, and user-facing analytics is no exception, often requiring filtered aggregations, subqueries, and complex joins. For this reason, traditional relational databases used to store transactional application data may not be suitable for user-facing analytics where scalability is a concern.
Low query latency
Since user-facing analytics are integrated into end-user software applications, they must refresh quickly to avoid degrading the user experience. Queries to the underlying datastore should return results in milliseconds, ideally in less than 100 milliseconds. Low query latency ensures that users don't perceive any lag in the analytics experience as they use the product.
High query concurrency
Unlike Business Intelligence (BI), which serves scheduled analytics reports to a few internal stakeholders, user-facing analytics systems must support on-demand querying from many concurrent users. Data systems for user-facing analytics must be designed to support high levels of query concurrency (thousands or millions of requests per second) while maintaining low query latency and high data freshness.
Historical data retention
User-facing analytics differs from streaming analytics or stream processing in that it must query historical data over unbounded time windows. Software users will want to be able to view analytics spanning their entire usage lifecycle, especially to compare metrics and results against historical data. User-facing analytics must maintain long histories of data; in complex and scalable architectures this can exceed billions of rows of raw event data.
User-facing analytics tools & architecture
The quality of a user-facing analytics system is only as good as the tools and architectures that underpin it.
Here are three typical architectures for user-facing analytics:
User-facing analytics with the application database
The simplest technological approach to user-facing analytics is using the existing application database technology to calculate metrics and serve them to the user.
For example, if you build your app on Postgres to store transactions, you could use Postgres to run analytics.
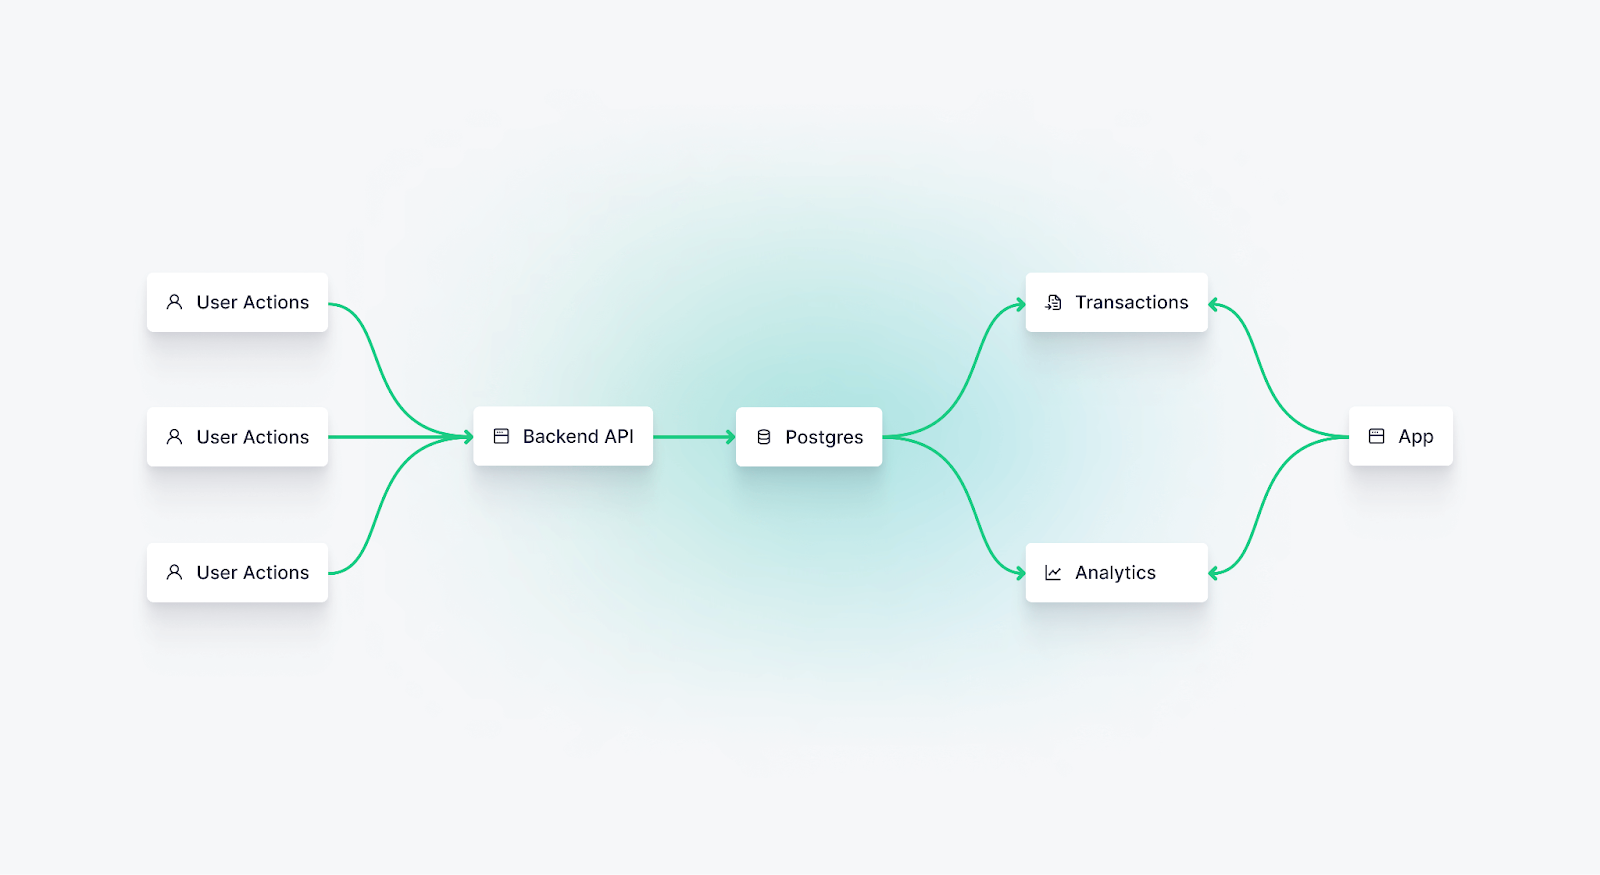
The benefit of this approach is its simplicity. You're already familiar with the database technology, you already have systems built to integrate that database with your application, and you can leverage it for both transactions and analytics.
Here's the problem with this approach:
- Traditional OLTP databases are optimized for transactions, not analytics. They can handle analytical queries with filters and aggregations at a small scale but will suffer as data and usage grows.
- This can overload your database. Without read replicas, querying your application database directly to support user-facing analytics places an undue load on the database and can impact the database's ability to manage transactional workloads. In extreme circumstances, this can bring down your application.
- It requires lots of work to scale. To scale with this approach, you'll have to perform complex database operations such as sharding and creating read replicas to distribute your compute across many machines. This brings a host of challenges that many application developers don't want to manage.
User-facing analytics with the data warehouse
Data warehouses have become very common technology, often serving as the central storage and compute engine for Business Intelligence and other business analytics systems. Companies use data warehouses to store structured models of their data and create reports and dashboards for internal stakeholders.
Data warehouses use online analytical processing (OLAP) technology, making them great for running complex analytics queries over large amounts of data.
However, data warehouses are not well suited as the backend for user-facing analytics. Data warehouses generally have indeterminate query latency and query concurrency constraints, making it difficult to scale them for user-facing analytics applications at a reasonable cost.
To overcome these constraints, data engineers usually extract data models and metrics from the data warehouse and load them into a low-latency datastore such as Redis or DynamoDB. They can then query this layer from the application to minimize problems with latency and concurrency.
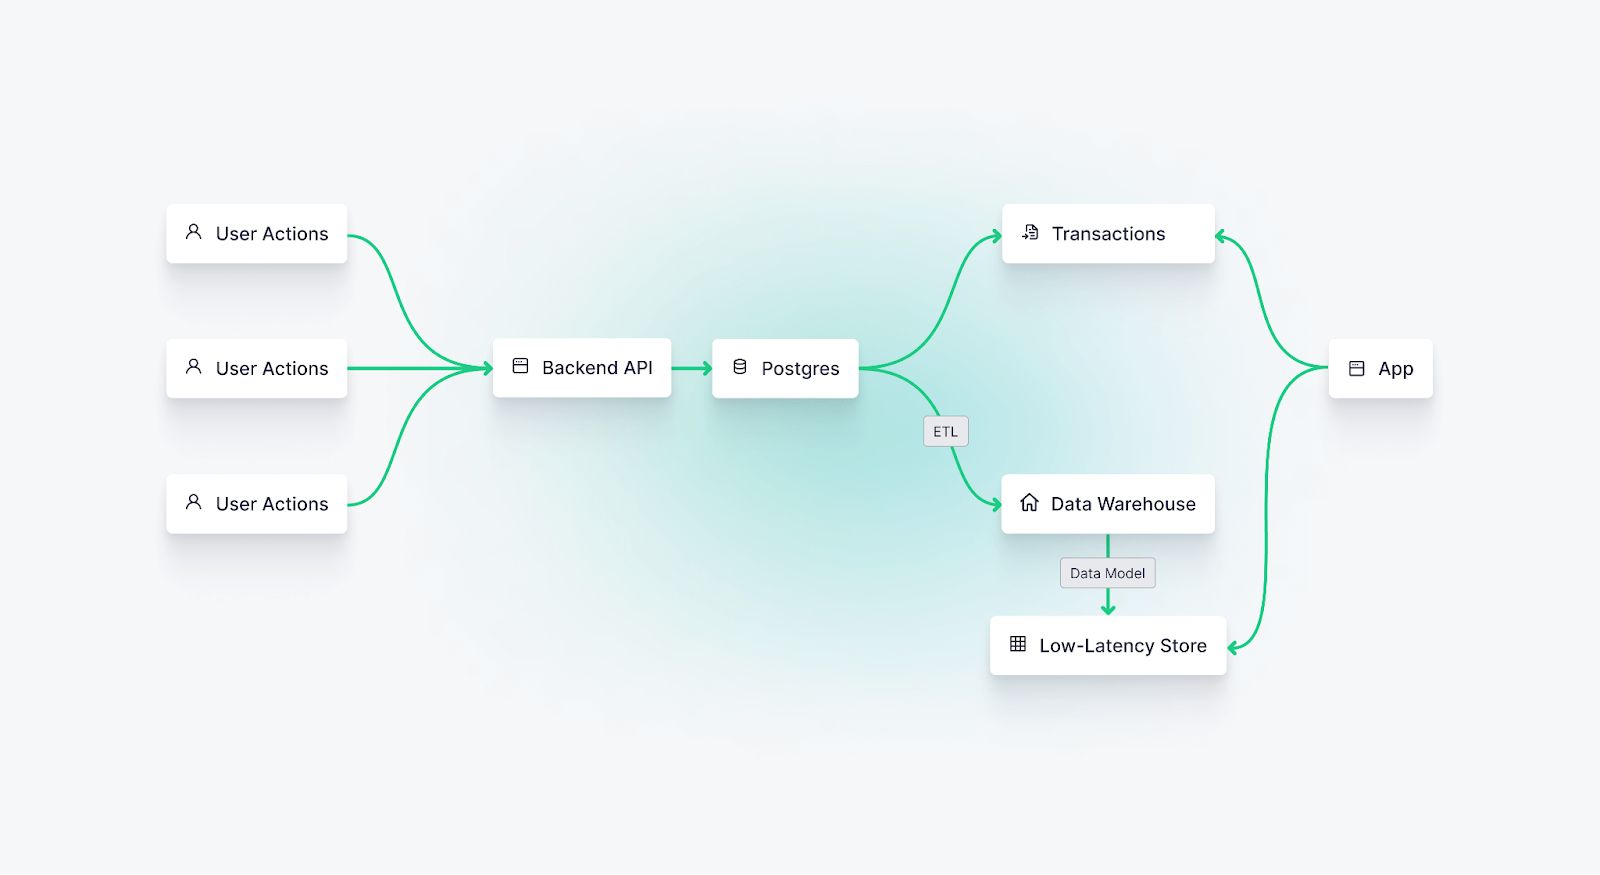
The problem with this approach is that it requires many technical handoffs. Data must first be captured into the data warehouse, often using change data capture (CDC) from the application database, then transformed, either before it hits the warehouse or in the warehouse itself (using tools like dbt), and finally exported to the low-latency store.
Specifically, the process of extracting data from the data warehouse and loading it into a low-latency data store typically uses a batch ETL process, which will result in stale data in the user-facing application. The only feasible way to scale this up is to run those batch models much more often, which increases costs inordinately.
User-facing analytics with real-time databases
Recently, real-time databases like ClickHouse® have emerged to provide an ideal data storage and compute layer for user-facing analytics. These databases are built for fast data ingestion, complex analytical queries, and high concurrency, low-latency access.
The state-of-the-art user-facing analytics architecture involves streaming data into a real-time database using an event-driven architecture, rather than relying on batch processes. These databases can be scaled to support low-latency queries from thousands or millions of concurrent users.

This architecture solves the problems presented by the prior two architectures. It offloads the analytical workload from the application database and bypasses the technical handoffs to move analytics from a data warehouse to a low-latency storage layer.
But, this approach can still be problematic.
Real-time databases are a relatively new technology that can be difficult to deploy and expensive to maintain. They're powerful but unwieldy, and they generally have smaller support communities, fewer native integrations, and fewer resources to help you develop on top of them.
While using a real-time database can reduce technical costs and improve end-user experience, it may come with a "complexity tax" that demands more specialized, niche resources.
Cost reduction strategies for user-facing analytics
Regardless of your architectural approach to user-facing analytics, consider these strategies to reduce costs as you scale. If you're building a SaaS application, you don't want expenses to increase disproportionately.
The cost of building any software or data system takes on multiple forms. Costs can appear as direct technology costs, such as hosting a database cluster or purchasing a SaaS license. They can also surface as resource costs, such as development time, maintenance overhead, and hiring costs.
Here are some strategies to reduce both direct technological costs and resource costs when building user-facing analytics:
Select purpose-built technology
As mentioned above, the wrong technology applied to user-facing analytics will incur added costs. Choose a real-time database (or better yet, an integrated real-time data platform) that is purpose-built for the end-to-end latency and concurrency requirements that user-facing analytics demands. Otherwise, you'll overspend on tools and technology as you try to manipulate them to serve a use case for which they are poorly suited.
Use tools with low-skill barriers
User-facing analytics can add a cognitive load to your team, as it often requires a unique set of data skills that many software developers still need to hone.
When you start building user-facing analytics, find technology that uses only skills that your team already has or for which you can easily hire.
For example, Tinybird is an integrated real-time data platform for building end-to-end user-facing analytics systems with nothing but SQL. Choosing technologies, like Tinybird, that abstract complexities into familiar languages like SQL will reduce personnel costs and time to market.
Optimize your queries
User-facing analytics requires low latency on complex queries for many concurrent users. This demands a lot of compute power even with purpose-built tech. Compute costs money; to spend less you need to compute less.
To achieve high-performance user-facing analytics, focus on aggressively optimizing your data pipelines using SQL best practices. Doing so can reduce compute costs by orders of magnitude.
Consider managed infrastructure
Managed infrastructure for user-facing analytics might seem like an additional cost on the surface, but consider the tradeoff between technology costs and development costs.
Managed infrastructure might be more expensive in direct costs than building infrastructure in-house. But, managed infrastructure can also reduce the time and resources needed to ship features into production. Depending on the complexity of your application, you'll generally need to hire fewer resources and spend less time maintaining infrastructure if you choose managed services, which can result in a net benefit even if direct costs are higher.
Choosing a platform for user-facing analytics
As you begin researching and developing user-facing analytics for your application, you'll need to find a technology stack that minimizes your cost and maximizes development speed.
Tinybird is a real-time data platform perfectly suited for building user-facing analytics. Hundreds of companies, from independent SaaS startups like Dub to large enterprises like Canva, FanDuel, and Vercel use Tinybird to quickly and cost-effectively ship user-facing analytics.
"Like many, we had a warehouse-centric data platform that just couldn't support the latency and concurrency requirements for user-facing analytics at any reasonable cost. When we moved those use cases to Tinybird, we shipped them 5x faster and at a 10x lower cost than our prior approach."
- Guy Needham, Staff Backend Engineer at Canva
Tinybird simplifies the user-facing analytics tech stack, giving you a managed service that integrates data ingestion, data storage, data querying, and data API layers into a single integrated platform.
How to build user-facing analytics with Tinybird
Building a user-facing analytics system with Tinybird is simple.
1. Connect your data
First, connect data from your application using one of Tinybird's managed Data Source connectors, or simply call Tinybird's HTTP streaming endpoint directly from your application code:
Tinybird will capture events as the stream and write them into a table in a fully managed ClickHouse® cluster.
2. Build your queries
In Tinybird, you use Pipes to construct chained, composable nodes of SQL and define your data transformations.
You can materialize your queries into auto-updating Materialized Views, or…
3. Publish data APIs
Tinybird simplifies one of the most difficult parts of building user-facing analytics by giving you the power to instantly turn SQL queries into fully documented, scalable REST APIs. Tinybird handles auth, observability, and scalability for your APIs, so you don't have to worry about building or maintaining an API layer for your analytics.
4. Build your app
Since Tinybird presents your queries as named HTTP Endpoints, fetching real-time data from your application code is as simple as an HTTP request using whichever language and library you're comfortable with.
Check out the Tinybird docs to learn more about using Tinybird to build user-facing analytics. You'll find end-to-end tutorials, videos, and additional resources to guide you as you build user-facing analytics into your application.
Why using Tinybird gives you an advantage
Tinybird is a real-time data platform designed to multiply your productivity when building user-facing analytics. Yes, it is underpinned by one of the world's fastest analytics databases (ClickHouse®), but that's not half the story.
Fast databases are table stakes. Tinybird doesn't just make your queries fast, it makes you fast. By bundling the data ingestion, data storage, data querying, and data publication layers into a single platform, Tinybird shrinks your development surface area to a single platform, where the only skill you need is SQL.
Fast databases make your queries fast. Tinybird makes you fast.
To learn more about Tinybird, check out the documentation. Ready to get started? Sign up for free with no time limit and no credit card required.
Want to talk through your customer-facing analytics use case with real-time data experts? Join our public Slack community to ask questions, get optimization tips, and learn from other developers building customer facing analytics with Tinybird.