Monitor your ingestion
In this guide, you can learn the basics of how to monitor your Data Source ingestion.
By being aware of your ingestion pipeline and leveraging Tinybird's features, you can monitor for any issues with the Data Flow Graph.
Remember: Every Tinybird use case is slightly different. This guide provides guidelines and an example scenario. If you have questions or want to explore more complicated ingestion monitoring scenarios, for instance looking for outliers by using the z-score or other anomaly detection processes, contact Tinybird at support@tinybird.co or in the Community Slack.
Prerequisites
You don't need an active Workspace to follow this guide, only an awareness of the core Tinybird concepts.
Key takeaways
- Understand and visualize your data pipeline.
- Leverage the Tinybird platform and tools.
- Be proactive: Build alerts.
Understand your data pipeline and flow
The first step to monitoring your ingestion to Tinybird is to understand what you're monitoring at a high level.
As a data team, the most common complaint you may get from your stakeholders is “the data is outdated” closely followed by "my dashboard is broken" but that's another matter. When stakeholders complain about outdated data, you and your data engineers start investigating, putting on the intellectual diving suit and checking the data pipelines upstream until you find the problem.
Understanding how data flows through those pipelines from the origin to the end is essential, and you should always know what your data flow "landscape" looks like.
Use the tools
Tinybird provides several tools to help you:
- The Data Flow Graph is Tinybird’s data lineage diagram. It visualizes how data flows within your project. It shows all the levels of dependencies, so you can see how all your Pipes, Data Sources, and Materialized Views connect.
- Service Data Sources are logs that allow you to keep track of almost everything happening data-wise within your system.
- Use Time Series in combination with Service Data Sources to allow you to visualize data ingestion trends and issues over time.
Build alerts
Lastly, you can create a personalized alert system by integrating your Pipes and Endpoints that point to certain key Service Data Sources with third-party services.
Example scenario: From spotting birds to spotting errors
Overview
In this example, a user with a passion for ornithology (the study of birds 🤓) has built a Workspace called bird_spotter (GitHub repository here). They're using it to analyze the number of birds they spot in their garden and when out on hikes. It uses Tinybird’s high frequency ingestion (Events API) and an updated legacy table in BigQuery, so the Data Sources are as follows:
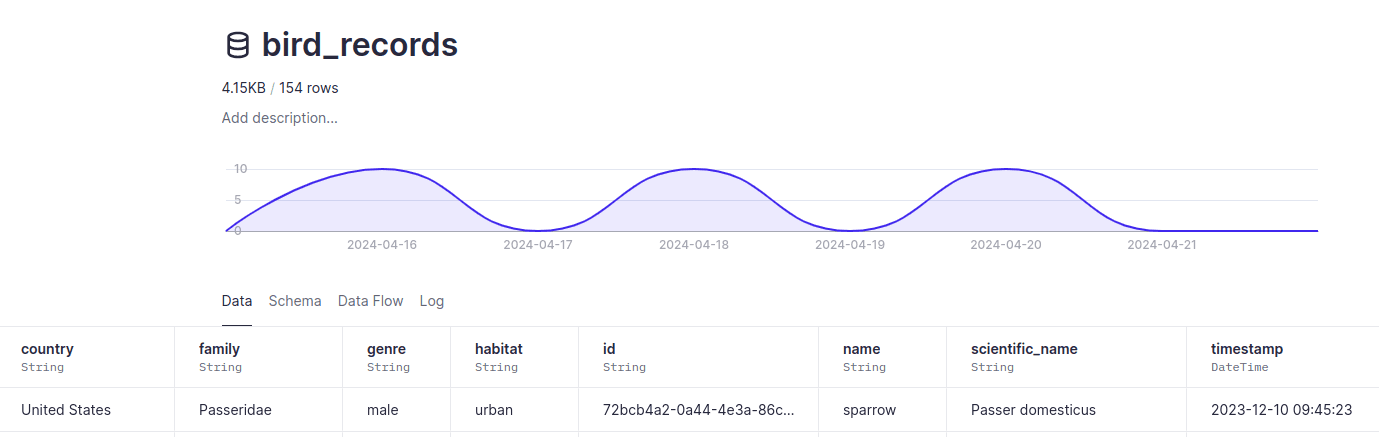
bird_records: A dataset containing bird viewings describing the time and bird details, which the Events API populates every day:
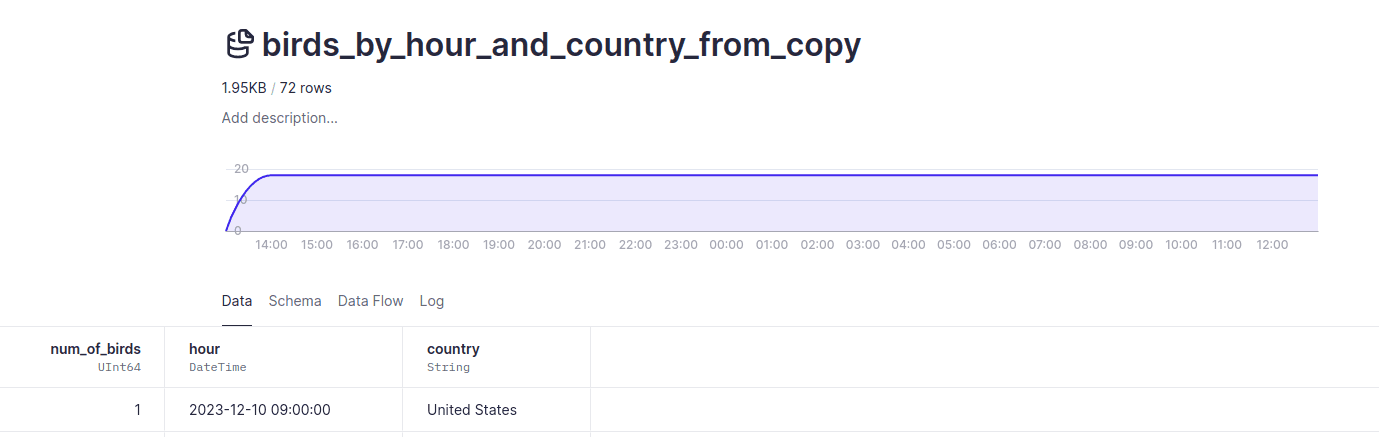
birds_by_hour_and_country_from_copy: An aggregated dataset of the bird views per hour and country, which a Copy Pipe populates every hour:
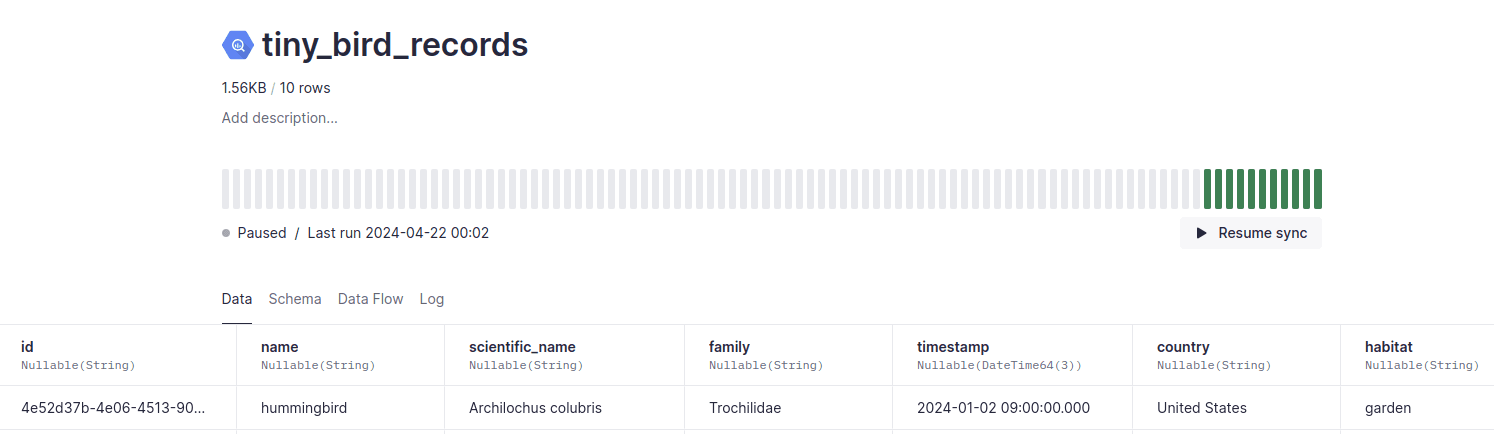
tiny_bird_records: A dataset with a list of tiny birds (i.e. hummingbirds), which Tinybird's BigQuery Connector replaces every day:
As you can see, the three Data Sources rely on three different methods of ingestion: Appending data using the high frequency API, aggregating and copying, and syncing from BigQuery.
To make sure that each of these processes is happening at the scheduled time, and without errors, this user needs to implement some monitoring.
Monitoring ingestion and spotting errors
Remember all those tools Tinybird offers? Here's how this user fits them together:
You can filter the Service Data Source called datasource_ops_log by Data Source and ingestion method. By building a quick Time Series, they can immediately see the "shape" of their ingestion:
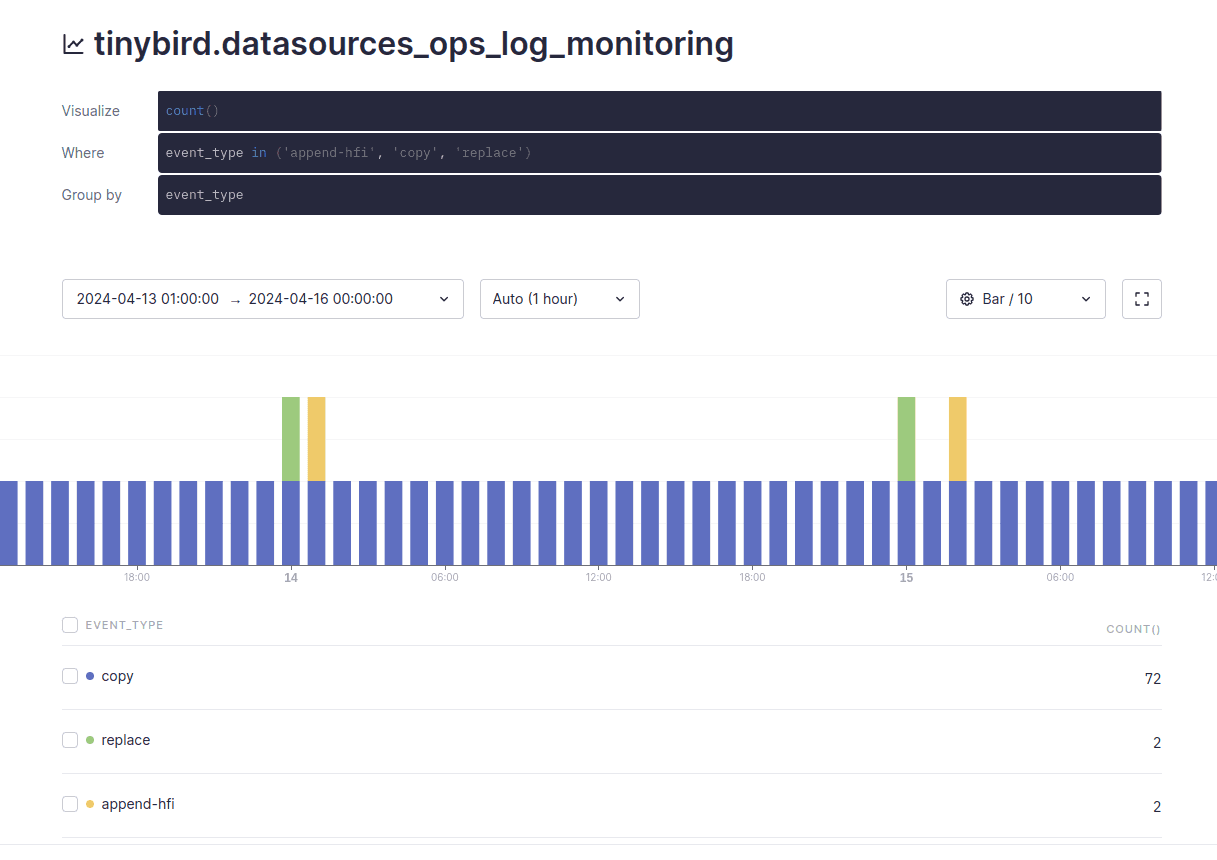
It shows yellow bars (HFI ingestion) and green bars (BigQuery sync) every day, and blue bars (copy operation) every hour. Now, the user can build a robust system for monitoring. Instead of only focusing on the ingestion method, they can create 3 different Pipes that have specific logic, and expose each Pipe as a queryable Endpoint. Each Endpoint aggregates key information about each ingestion method, and count and flag errors.
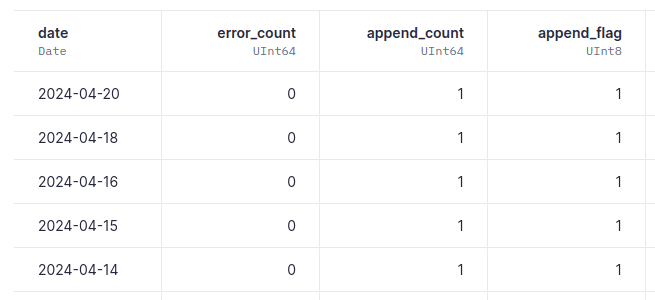
Endpoint 1: Check append-hfi operations in bird_records
SELECT
  toDate(timestamp) as date,
  sum(if(result = 'error', 1, 0)) as error_count,
  count() as append_count,
  if(append_count > 0, 1, 0) as append_flag
FROM
  tinybird.datasources_ops_log
WHERE
  datasource_name = 'bird_records'
AND
  event_type = 'append-hfi'
GROUP BY date
ORDER BY date DESC
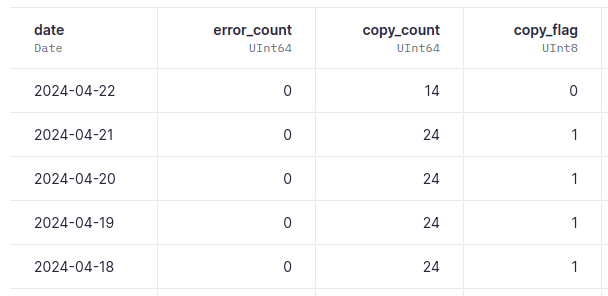
Endpoint 2: Check copy operations in birds_by_hour_and_country_from_copy
SELECT
  toDate(timestamp) as date,
  sum(if(result = 'error', 1, 0)) as error_count,
  count() as copy_count,
  if(copy_count >= 24, 1, 0) as copy_flag
FROM
  tinybird.datasources_ops_log
WHERE
  datasource_name = 'birds_by_hour_and_country_from_copy'
AND
  event_type = 'copy'
GROUP BY date
ORDER BY date DESC
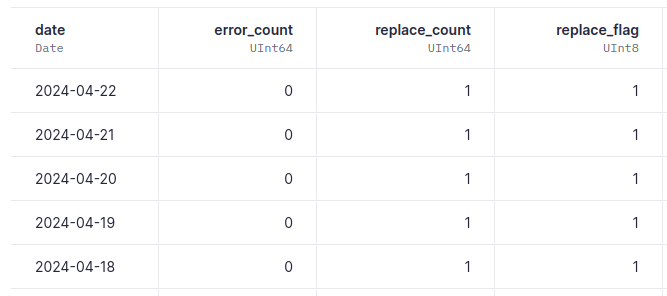
Endpoint 3: Check replace operations in tiny_bird_records
SELECT
  toDate(timestamp) as date,
  sum(if(result = 'error', 1, 0)) as error_count,
  count() as replace_count,
  if(replace_count > 0, 1, 0) as replace_flag
FROM
  tinybird.datasources_ops_log
WHERE
  datasource_name = 'tiny_bird_records'
AND
  event_type = 'replace'
GROUP BY date
ORDER BY date DESC
Using the output
Because these Pipes expose API Endpoints, they can be consumed by any third party app to build real-time alerts. This could be something like DataDog by following this helpful integration guide, Grafana using this plugin, PagerDuty, Uptime Robot, or GitHub Actions with a cron job system checking for errors.
Check the limits page for limits on ingestion, queries, API Endpoints, and more.
Example GitHub Actions implementation
In the bird_spotter example repo, you can see the scripts and workflows that the user has built:
ingest.pyandmonitor.pyare Python scripts that run daily. The first ingests data in this case from a sample csv and the second checks if the append, copy, and sync operations have happened and are error-free. Because this guide is an example scenario, there's a function that randomly chooses not to ingest, so there's always an error present.ingest.ymlandmonitor.ymlare yaml files that schedule those daily runs.
The output of a daily check would look something like this:
INFO:__main__:Alert! Ingestion operation missing. Last ingestion date is not today: 2024-04-16
INFO:__main__:Last copy_count count is equal to 9. All fine!
INFO:__main__:Last replace_count count is equal to 1. All fine!
INFO:__main__:Alerts summary:
INFO:__main__:Append error count: 1
INFO:__main__:Copy error count: 0
INFO:__main__:Replace error count: 0
In this instance, the ingestion script has randomly failed to append new data, and triggers an alert that the user can action. In contrast, copy operations and replace counts have run as expected: 9 copies and 1 BigQuery sync occurred since 00:00.
Example scenario: Detect out-of-sync Data Sources
Overview
Some Tinybird Connectors like BigQuery or Snowflake use async jobs to keep your Data Sources up to date. These jobs produce records with the result sent to the datasources_ops_log Service Data Source, both for successful and failed runs.
The following example configures a new Tinybird Endpoint that reports Data Sources that are out of sync. It's then possible to leverage that data in your monitoring tool of choice (Grafana, Datadog, UptimeRobot, etc.).
Endpoint: Get out of sync Data Sources using datasources_ops_log
To get the Data Sources that haven't been successfully updated in the last hour, check their sync jobs results in the datasources_ops_log:
select
  datasource_id,
  argMax(datasource_name, timestamp) as datasource_name,
  max(case when result = 'ok' then timestamp end) as last_successful_sync
from
  tinybird.datasources_ops_log
where
  arrayExists(x -> x in ('bigquery','snowflake'), Options.Values)
  and toDate(timestamp) >= today() - interval 30 days
  and result = 'ok'
group by
  datasource_id
having
  max(event_type = 'delete') = false
  and last_successful_sync < now() - interval 1 hour
Next steps
- Read the in-depth docs on Tinybird's Service Data Sources.
- Learn how to Optimize your data project.
- Learn about the difference between log analytics and log analysis in the blog "Log Analytics: how to identify trends and correlations that Log Analysis tools cannot".