Build a user-facing web analytics dashboard
In this guide you'll learn how to build a user-facing web analytics dashboard. You'll use Tinybird to capture web clickstream events, process the data in real-time, and expose metrics as APIs. You'll then deploy a Next.js app to visualize your metrics.
GitHub Repository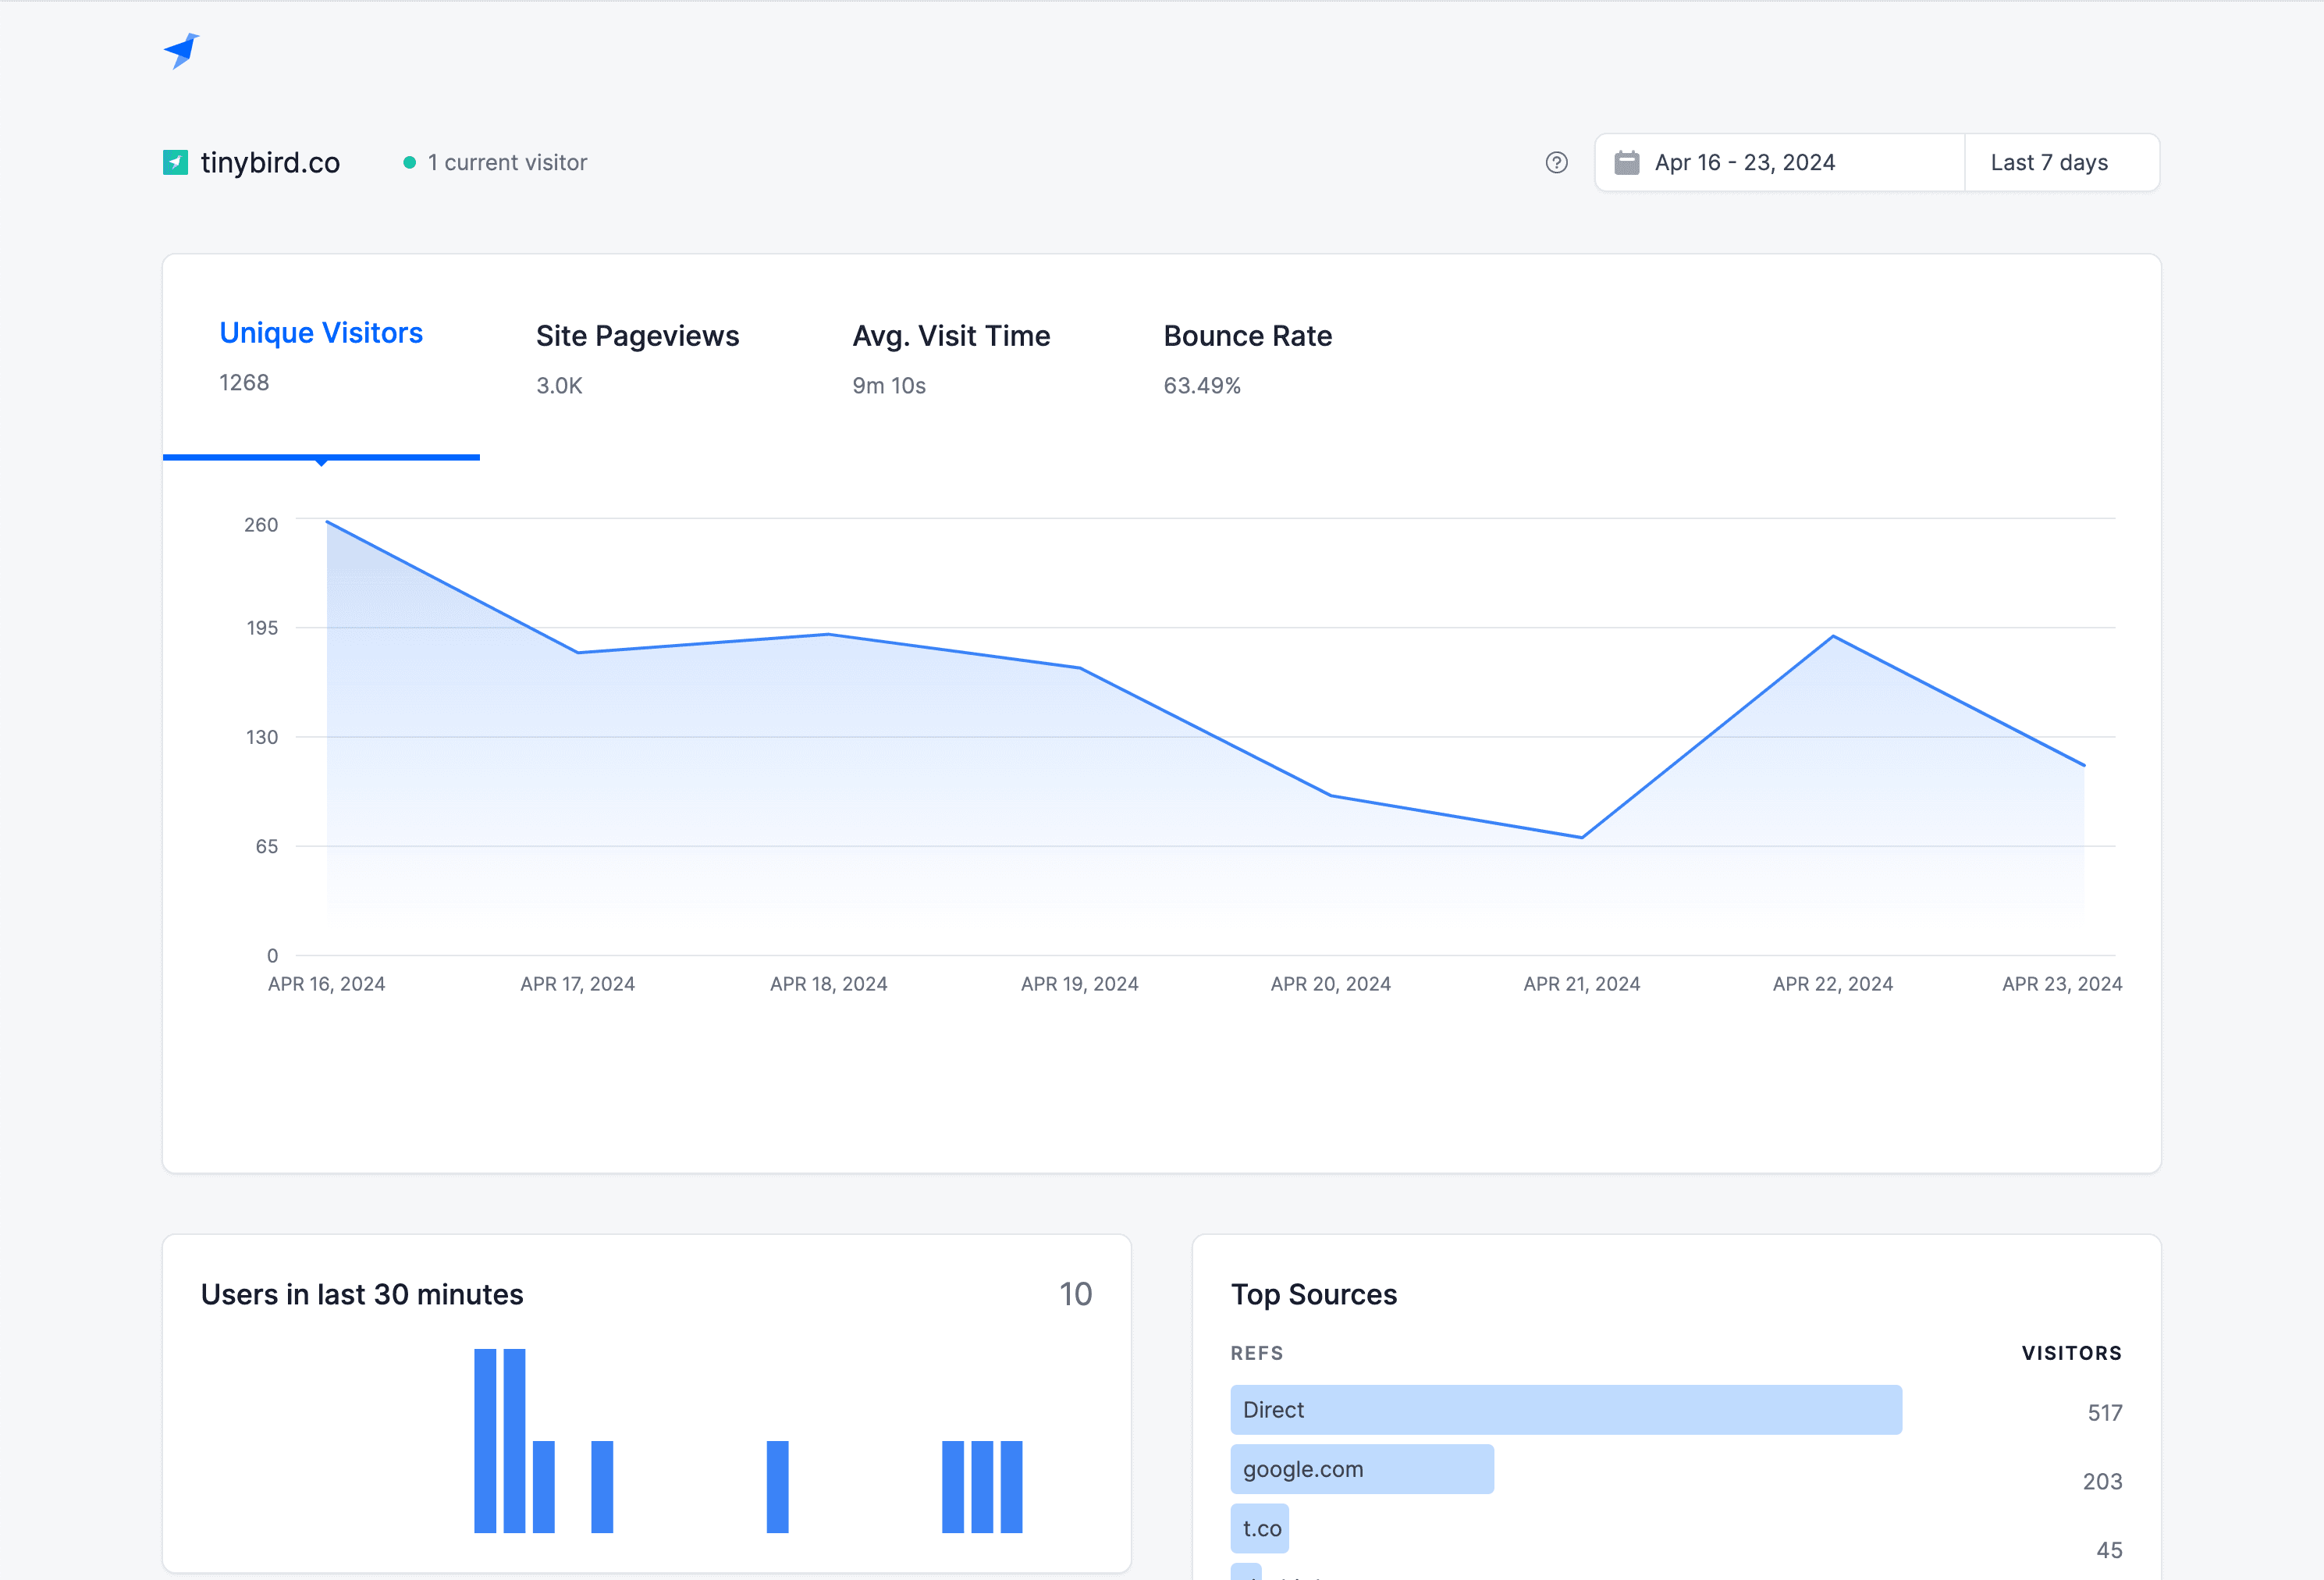
In this tutorial, you will learn how to:
- Stream unstructured events data to Tinybird with the Events API.
- Parse those events with a global SQL Node that you can reuse in all your subsequent Tinybird Pipes.
- Build performant queries to calculate user-facing analytics metrics.
- Optimize query performance with Materialized Views.
- Publish your metrics as API Endpoints and integrate them into a user-facing Next.js app.
Prerequisites
To complete this tutorial, you'll need the following:
- A free Tinybird account
- An empty Tinybird Workspace
- Node.js >=20.11
- Python >=3.8
This tutorial includes a Next.js app for frontend visualization. For more information about how the Next.js app is designed and deployed, read the repository README.
The steps in this tutorial are completed using the Tinybird Command Line Interface (CLI). If you're not familiar with it, read the CLI docs or just give it a go! You can copy and paste every code snippet and command in this tutorial.
1. Create a Tinybird Data Source to store your events
First, you need to create a Tinybird Data Source to store your web clickstream events. Create a new directory called tinybird in your project folder and install the Tinybird CLI:
Install the Tinybird CLI
mkdir tinybird
cd tinybird
python -m venv .venv
source .venv/bin/activate
pip install tinybird-cli
Copy the user admin Token and authenticate the CLI:
Authenticate the Tinybird CLI
tb auth --token <your token>
Initialize an empty Tinybird project and navigate to the /datasources directory, then create a new file called analytics_events.datasource:
Create a Data Source
tb init
cd datasources
touch analytics_events.datasource
Open the file in your preferred code editor and paste the following contents:
analytics_events.datasource
DESCRIPTION >
    Analytics events landing data source

SCHEMA >
    `timestamp` DateTime `json:$.timestamp`,
    `session_id` String `json:$.session_id`,
    `action` LowCardinality(String) `json:$.action`,
    `version` LowCardinality(String) `json:$.version`,
    `payload` String `json:$.payload`

ENGINE MergeTree
ENGINE_PARTITION_KEY toYYYYMM(timestamp)
ENGINE_SORTING_KEY timestamp
ENGINE_TTL timestamp + toIntervalDay(60)
If you pass a non-existent Data Source name to the Events API (as you're about to do), Tinybird automatically creates a new Data Source of that name with an inferred schema. By creating the Data Source ahead of time in this file, you have more control over the schema definition, including column types and sorting keys. For more information about creating Tinybird Data Sources, read the Data Source docs.
In the /tinybird directory, save and push the file to Tinybird:
Push the Data Source to Tinybird
cd ..
tb push datasources/analytics_events.datasource
Confirm that you have a new Data Source:
tb datasource ls
You should see analytics_events in the result. Congrats, you have a Tinybird Data Source!
2. Stream mock data to your Data Source
This tutorial uses Mockingbird, an open source mock data stream generator, to stream mock web clickstream events to your Data Source. Mockingbird generates a JSON payload based on a predefined schema and posts it to the Tinybird Events API, which then writes the data to your Data Source. You can explore the Mockingbird web UI, or follow the steps below to complete the same actions using the Mockingbird CLI.
In a separate terminal window (outside your current virtual environment) install the Mockingbird CLI:
Install Mockingbird
npm install -g @tinybirdco/mockingbird-cli
Run the following command to stream 50,000 mock web clickstream events to your analytics_events Data Source at 50 events per second via the Events API. This command uses the predefined "Web Analytics Starter Kit" Mockingbird template schema to generate mock web clickstream events.
Copy your User Admin Token to the clipboard with tb token copy dashboard, and use it in the following command (and change the endpoint argument depending on your Workspace region if required):
Stream to Tinybird with a template
mockingbird-cli tinybird --template "Web Analytics Starter Kit" --eps 50 --limit 50000 --datasource analytics_events --token <your_user_admin_token> --endpoint gcp_europe_west3
Confirm that events are being written to the analytics_events Data Source by running the following command a few times:
tb sql 'select count() from analytics_events'
You should see the count incrementing up by 50 every second or so. Congratulations, you're ready to start processing your events data!
3. Parse the raw JSON events
The analytics_events Data Source has a payload column which stores a string of JSON data. To begin building your analytics metrics, you need to parse this JSON data using a Tinybird Pipe.
When you're dealing with unstructured data that's likely to change in the future, it's a wise design pattern to retain the unstructured data as a JSON string in a single column. This gives you flexibility to change your upstream producers without breaking ingestion. You can then parse (and materialize) this data downstream.
Navigate to the /pipes directory and create a new file called analytics_hits.pipe:
Create a Pipe
touch analytics_hits.pipe
Open the file and paste the following contents:
analytics_hits.pipe
DESCRIPTION >
    Parsed `page_hit` events, implementing `browser` and `device` detection logic.

TOKEN "dashboard" READ

NODE parsed_hits
DESCRIPTION >
    Parse raw page_hit events

SQL >
    SELECT
        timestamp,
        action,
        version,
        coalesce(session_id, '0') as session_id,
        JSONExtractString(payload, 'locale') as locale,
        JSONExtractString(payload, 'location') as location,
        JSONExtractString(payload, 'referrer') as referrer,
        JSONExtractString(payload, 'pathname') as pathname,
        JSONExtractString(payload, 'href') as href,
        lower(JSONExtractString(payload, 'user-agent')) as user_agent
    FROM analytics_events
    where action = 'page_hit'

NODE endpoint
SQL >
    SELECT
        timestamp,
        action,
        version,
        session_id,
        location,
        referrer,
        pathname,
        href,
        case
            when match(user_agent, 'wget|ahrefsbot|curl|urllib|bitdiscovery|\+https://|googlebot')
            then 'bot'
            when match(user_agent, 'android')
            then 'mobile-android'
            when match(user_agent, 'ipad|iphone|ipod')
            then 'mobile-ios'
            else 'desktop'
        END as device,
        case
            when match(user_agent, 'firefox')
            then 'firefox'
            when match(user_agent, 'chrome|crios')
            then 'chrome'
            when match(user_agent, 'opera')
            then 'opera'
            when match(user_agent, 'msie|trident')
            then 'ie'
            when match(user_agent, 'iphone|ipad|safari')
            then 'safari'
            else 'Unknown'
        END as browser
    FROM parsed_hits
This Pipe contains two Nodes. The first Node, called parsed_hits, extracts relevant information from the JSON payload using the JSONExtractString() ClickHouse® function and filters to only include page_hit actions.
The second Node, called endpoint, selects from the parsed_hits Node and further parses the user_agent to get the device and browser for each event.
Additionally, this code gives the Pipe a description, and creates a Token called dashboard with READ scope for this Pipe.
Navigate back up to the /tinybird directory and push the Pipe to Tinybird:
Push the Pipe to Tinybird
tb push pipes/analytics_hits.pipe
When you push a Pipe file, Tinybird automatically publishes the last Node as an API Endpoint unless you specify the Pipe as something else (more on that below), so it's best practice to call your final Node "endpoint". You can unpublish an API Endpoint at any time using tb pipe unpublish <pipe_name>.
You now have a public REST API that returns the results of the analytics_hits Pipe! Get your Admin Token again with tb token copy dashboard and test your API with the command:
curl "https://api.tinybird.co/v0/pipes/analytics_hits.json?token=<your_token>"
Replace the Tinybird API hostname/region with the right API URL region that matches your Workspace. Your Token lives in the Workspace under "Tokens".
You should see a JSON response that looks something like this:
Example API response
{
    "meta":
    [
        {
            "name": "timestamp",
            "type": "DateTime"
        },
        {
            "name": "action",
            "type": "LowCardinality(String)"
        },
        {
            "name": "version",
            "type": "LowCardinality(String)"
        },
        {
            "name": "session_id",
            "type": "String"
        },
        {
            "name": "location",
            "type": "String"
        },
        {
            "name": "referrer",
            "type": "String"
        },
        {
            "name": "pathname",
            "type": "String"
        },
        {
            "name": "href",
            "type": "String"
        },
        {
            "name": "device",
            "type": "String"
        },
        {
            "name": "browser",
            "type": "String"
        }
    ],

    "data":
    [
        {
            "timestamp": "2024-04-24 18:24:21",
            "action": "page_hit",
            "version": "1",
            "session_id": "713355c6-6b98-4c7a-82a9-e19a7ace81fe",
            "location": "",
            "referrer": "https:\/\/www.kike.io",
            "pathname": "\/blog-posts\/data-market-whitebox-replaces-4-data-stack-tools-with-tinybird",
            "href": "https:\/\/www.tinybird.co\/blog-posts\/data-market-whitebox-replaces-4-data-stack-tools-with-tinybird",
            "device": "bot",
            "browser": "chrome"
        },
        ...
    ]

    "rows": 150,

    "statistics":
    {
        "elapsed": 0.006203411,
        "rows_read": 150,
        "bytes_read": 53609
    }
}
In Tinybird, you can SELECT FROM any API Endpoint published in your Workspace in any Pipe. Tinybird won't call the API Endpoint directly, rather it will treat the Endpoint as additional Node(s) and construct a final query. In this tutorial, you'll query the analytics_hits API Endpoint in subsequent Pipes.
4. Calculate aggregates for pageviews, sessions, and sources
Next, you'll create three Materialized Views to store aggregates for the following:
- pageviews
- sessions
- sources
Later on, you'll query from the Materialized Views that you're creating here.
From the /datasources directory in the Tinybird project, create three new Data Source files:
touch analytics_pages_mv.datasource analytics_sessions_mv.datasource analytics_sources_mv.datasource
Open the analytics_pages_mv.datasource file and paste in the following contents:
analytics_pages_mv.datasource
SCHEMA >
    `date` Date,
    `device` String,
    `browser` String,
    `location` String,
    `pathname` String,
    `visits` AggregateFunction(uniq, String),
    `hits` AggregateFunction(count)

ENGINE AggregatingMergeTree
ENGINE_PARTITION_KEY toYYYYMM(date)
ENGINE_SORTING_KEY date, device, browser, location, pathname
Do the same for analytics_sessions_mv.datasource and analytics_sources_mv.datasource, copying the code from the GitHub repository for this tutorial.
These Materialized View Data Sources use an AggregatingMergeTree Engine. If you're new to Tinybird, don't worry about this for now. To learn more about Table Engines in ClickHouse, read this.
Next, you'll create three Pipes that calculate the aggregates and store the data in the Materialized View Data Sources you just created.
From the /pipes directory, create three new Pipe files:
touch analytics_pages.pipe analytics_sessions.pipe analytics_sources.pipe
Open analytics_pages.pipe and paste the following:
NODE analytics_pages_1
DESCRIPTION >
    Aggregate by pathname and calculate session and hits

SQL >
    SELECT
        toDate(timestamp) AS date,
        device,
        browser,
        location,
        pathname,
        uniqState(session_id) AS visits,
        countState() AS hits
    FROM analytics_hits
    GROUP BY date, device, browser, location, pathname

TYPE MATERIALIZED
DATASOURCE analytics_pages_mv
This code calculates aggregates for pageviews, and designates the Pipe as a Materialized View with analytics_pages_mv as the target Data Source.
Note that you're using the -State modifier on your aggregate functions in this Pipe. Tinybird stores intermediate aggregate states in the Materialized View, which you will merge at query time. For more information on how this process works, read this guide on Materialized Views.
Do this for the remaining two Pipes, copying the code from the GitHub repository.
Back in the /tinybird directory, push these new Pipes and Data Sources to Tinybird. This populates the Materialized Views with your Mockingbird data:
Push to Tinybird
tb push pipes --push-deps --populate
Now, as new events arrive in the analytics_events Data Source, these Pipes will process the data and update the aggregate states in your Materialized Views as new data arrives.
6. Generate session count trend for the last 30 minutes
In this step, you'll use Tinybird Pipes to calculate user-facing analytics metrics and publish them as REST APIs.
The first Pipe you create, called trend, will calculate the number of sessions over the last 30 minutes, grouped by 1 minute intervals.
From the /pipes directory, create a file called trend.pipe:
Create trend.pipe
touch trend.pipe
Open this file and paste the following:
trend.pipe
DESCRIPTION >
    Visits trend over time for the last 30 minutes, filling in the blanks.

TOKEN "dashboard" READ

NODE timeseries
DESCRIPTION >
    Generate a timeseries for the last 30 minutes, so we call fill empty data points

SQL >
    with (now() - interval 30 minute) as start
    select addMinutes(toStartOfMinute(start), number) as t
    from (select arrayJoin(range(1, 31)) as number)

NODE hits
DESCRIPTION >
    Get last 30 minutes metrics grouped by minute

SQL >
    select toStartOfMinute(timestamp) as t, uniq(session_id) as visits
    from analytics_hits
    where timestamp >= (now() - interval 30 minute)
    group by toStartOfMinute(timestamp)
    order by toStartOfMinute(timestamp)

NODE endpoint
DESCRIPTION >
    Join and generate timeseries with metrics for the last 30 minutes

SQL >
    select a.t, b.visits from timeseries a left join hits b on a.t = b.t order by a.t
This Pipe contains three Nodes:
- The first Node, called
timeseries, generates a simple result set with 1-minute intervals for the last 30 minutes. - The second Node, called
hits, calculates total sessions over the last 30 minutes, grouped by 1-minute intervals. - The third Node, called
endpoint, performs a left join between the first two Nodes, retaining all of the 1-minute intervals from thetimeseriesNode.
7. Calculate the top pages visited
Next, you'll create a Pipe called top_pages to calculate a sorted list of the top pages visited over a specified time range. This Pipe will query the analytics_pages_mv Data Source you created in the prior steps, and it will use Tinybird's templating language to define query parameters that you can use to dynamically select a time range and implement pagination in the response.
From the /pipes directory, create the top_pages.pipe file:
Create top_pages.pipe
touch top_pages.pipe
Open the file and paste the following:
DESCRIPTION >
    Most visited pages for a given period.
    Accepts `date_from` and `date_to` date filter. Defaults to last 7 days.
    Also `skip` and `limit` parameters for pagination.

TOKEN "dashboard" READ

NODE endpoint
DESCRIPTION >
    Group by pagepath and calculate hits and visits

SQL >
    %
    select pathname, uniqMerge(visits) as visits, countMerge(hits) as hits
    from analytics_pages_mv
    where
        {% if defined(date_from) %}
            date
            >=
            {{ Date(date_from, description="Starting day for filtering a date range", required=False) }}
        {% else %} date >= timestampAdd(today(), interval -7 day)
        {% end %}
        {% if defined(date_to) %}
            and date
            <=
            {{ Date(date_to, description="Finishing day for filtering a date range", required=False) }}
        {% else %} and date <= today()
        {% end %}
    group by pathname
    order by visits desc
    limit {{ Int32(skip, 0) }},{{ Int32(limit, 50) }}
Note the use of the -Merge modifiers on the end of the aggregate function. This modifier is used to perform a final merge on the aggregate states in the Materialized View. Read this Guide for more details.
8. Create the remaining API Endpoints
In the GitHub repository, you'll find five additional Pipe files that calculate other various user-facing metrics:
Create those into your /pipes directory:
touch kpis.pipe top_browsers.pipe top_devices.pipe top_locations.pipe top_sources.pipe
And copy the file contents from the GitHub examples into your files. Finally, in the /tinybird directory, push all these new Pipes to Tinybird:
tb push pipes
Congrats! You now have seven API Endpoints that you will integrate into your Next.js app to provide data to your dashboard components.
9. Deploy the Next.js app
You can easily deploy the accompanying Next.js app to Vercel by clicking in this button (you'll need a Vercel account):
Deploy with VercelFirst, select the Git provider where you'll clone the Git repository:

Next, set the following environment variables:
NEXT_PUBLIC_TINYBIRD_AUTH_TOKEN: your Tinybird TokenNEXT_PUBLIC_TINYBIRD_HOST: your Tinybird Region (e.g.https://api.tinybird.co)NEXT_PUBLIC_BASE_URL: The URL where you will publish your app (e.g.https://my-analytics.com)

Click "Deploy" and you're done! Explore your dashboard and have a think about how you'd like to adapt or extend it in the future.
Next steps
- Understand today's real-time analytics landscape with Tinybird's definitive guide.
- Learn how to implement multi-tenant security in your user-facing analytics.