


Tinybird is built on ClickHouse®. We use it to turn high-volume analytical data into product surfaces, APIs, reports, and agents.
And yes, for a long time, parts of our own analytics loop still lived in external tools.
That was not stupid. It was practical. We used PostHog, built charts and dashboards on top of it, and relied on it for session recordings. But the useful context kept pulling us back into Tinybird.
Birdwatcher is our internal analytics platform. It started as observability for customer success, billing, support, platform, and internal teams. Then we added an agent over that data. Then growth analytics became another context layer on top of the same source of truth.
This is the story of that shift.
The problem was not pageviews
Pageviews are useful. Funnels are useful. Session recordings are useful. Product analytics tools exist for good reasons.
Tools like PostHog can answer many product analytics questions. We were already sending a lot of events there. We could have sent more.
The problem was not that PostHog could not answer analytics questions. The problem was that the data we needed to answer the most useful questions was already inside our own Tinybird workspaces.
Product usage. Workspace shape. Logs. Request behavior. CLI operations. Signups. Invites. Billing changes. Support context. Customer success context. Incident context.
We could duplicate more of that into another analytics silo and query it back out. Or we could build dashboards, reports, and an agent on top of the operational data we already trusted.
But the questions we cared about started crossing tool boundaries:
- What did a user read before signing up?
- What happened in the product after signup?
- Did they use the CLI, deploy, or create anything meaningful?
- What errors did they hit?
- What did they see in the browser during the session?
- Can someone ask this in Slack without knowing the data model?
Those questions are awkward when the data lives in separate systems: analytics and replay tools, billing and CRM, service logs, notebooks, and custom scripts.
Sending more events to an external tool would not solve that by itself. The useful context was already internal. We had it because Tinybird teams were already querying internal workspaces for incidents, support, billing, customer success, and platform debugging.
The missing layer was not raw data. The missing layer was dashboards, reports, and an agent over data we already trusted.
Birdwatcher started as internal observability
The first version of Birdwatcher was not a growth project.
It was an internal observability and analytics platform built on top of our own data. Customer-facing teams used it to inspect accounts and workspaces. Billing, support, and platform teams used it to understand usage and costs, investigate incidents, and keep customer context close to the operational data.
That matters because the growth work did not start from zero. We already had:
- Internal service data sources.
- Organization and workspace context.
- Usage and cost data.
- Logs and operational signals.
- Billing and subscription data.
- A habit of using Tinybird to debug real problems.
At that point, Birdwatcher was mostly analytics for humans: dashboards, tables, filters, and SQL.
People still had to know where to look. They had to know which table mattered, which filters to apply, which dashboard was current, and which query was safe to run.
That worked for engineers and data-aware teams. It did not work as a company interface to product and platform data.
The agent changed how people used the data
The next step was adding an agent over the same internal context.
We have talked about this agent before. Jorge shared the early version on LinkedIn. The important part here is what happened after it worked for operational questions.
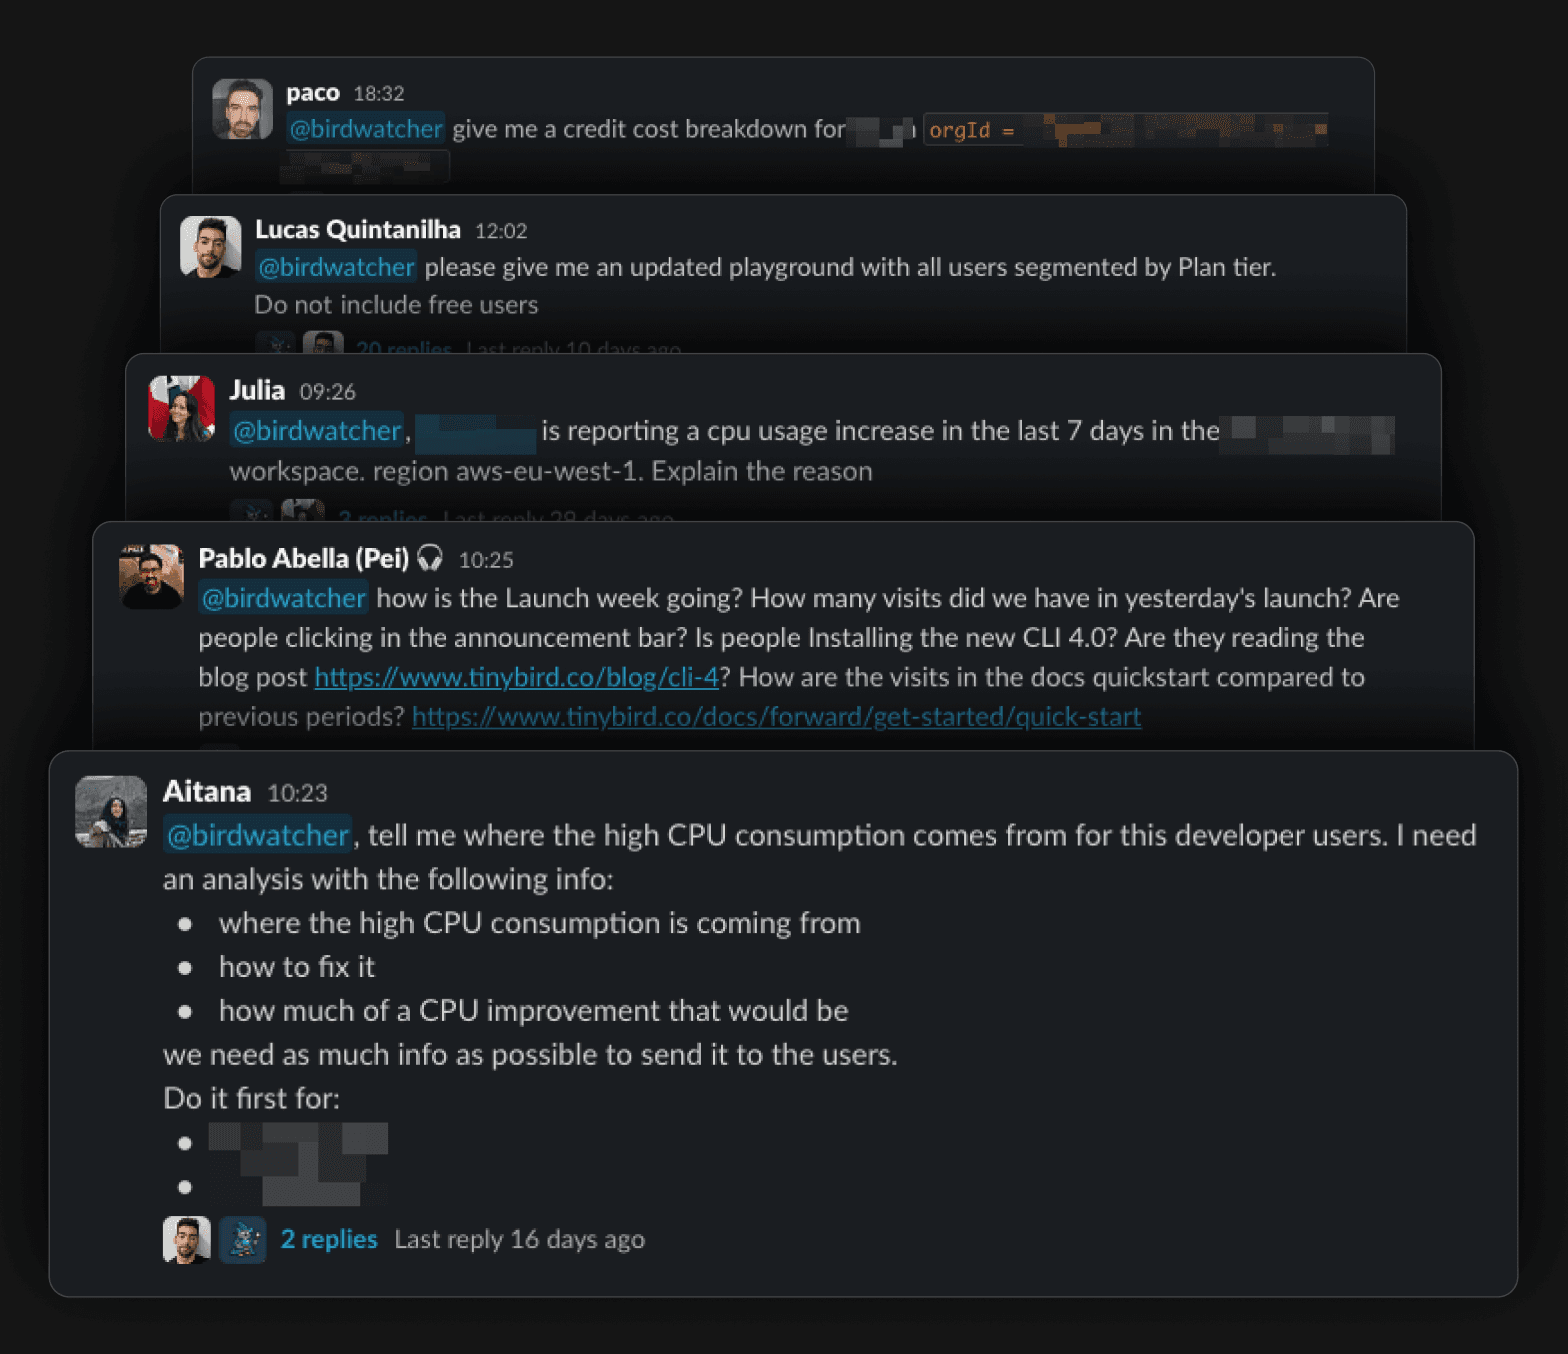
The agent runs through Slack. It answers operational questions about accounts, workspace errors, and usage. It also answers growth questions that connect acquisition, activation, billing, and product behavior.
Underneath, it has the context a teammate would need to answer safely: table knowledge, business rules, validated queries, previous learnings, and tools for reading Tinybird data without guessing. Validated queries are known-good query patterns that humans have reviewed. When Birdwatcher gives a useful answer, we can feed that back so it knows how to answer a similar question next time.
The agent is also constrained. It can query the internal workspace it has context for, but it cannot write or modify data. It runs inside our internal Slack, not as a public interface.
That changed who could use Birdwatcher.
Product, platform, support, and customer-facing teams could ask questions like:
- What happened in this workspace?
- Why is this organization seeing errors?
- What changed before this incident?
- Is this user blocked?
- Which endpoints or pipes are failing?
- What does usage look like for this account?
They did not need to find the right dashboard first. They did not need to write SQL. They could ask in the same place where the work was already happening.
The signal that it worked was simple: people kept asking. The agent now handles dozens of questions a week in public internal channels, plus questions in private channels. Growth, customer success, platform, product, and other teams all use it.
That was the turning point for growth.
Once the agent could answer operational questions, website analytics and product analytics stopped looking like a separate stack. They looked like another context layer.
Growth signals joined the source of truth
We started adding the growth signals to the same internal Source of Truth workspace:
- Website, docs, bot, and crawler events.
- Product UI, CLI, API, and deployment activity.
- Billing, subscription, organization, and user metadata.
- Brand Radar runs, session recording chunks, reports, and annotations.
Most of those signals use the same ingestion primitives we recommend to customers, including the Events API for high-volume JSON events.
The Source of Truth workspace is not a raw event dump. It is where we model operational and growth data together so dashboards, reports, recordings, journeys, and the Slack agent read from the same definitions. The exact architecture deserves its own post. For this story, the important part is that growth joined the data layer teams were already using to debug and operate the product.
The dashboard is not the architecture. The data layer is.
Dashboards are one consumer. Reports are another. Session replay is another. The Slack agent is another. The same modeled data can answer a chart, a weekly report, an AI summary, or a Slack question.
This is the part that external analytics tools could not fix for us by receiving more events. We did not only need more collection. We needed joins across operational truth.
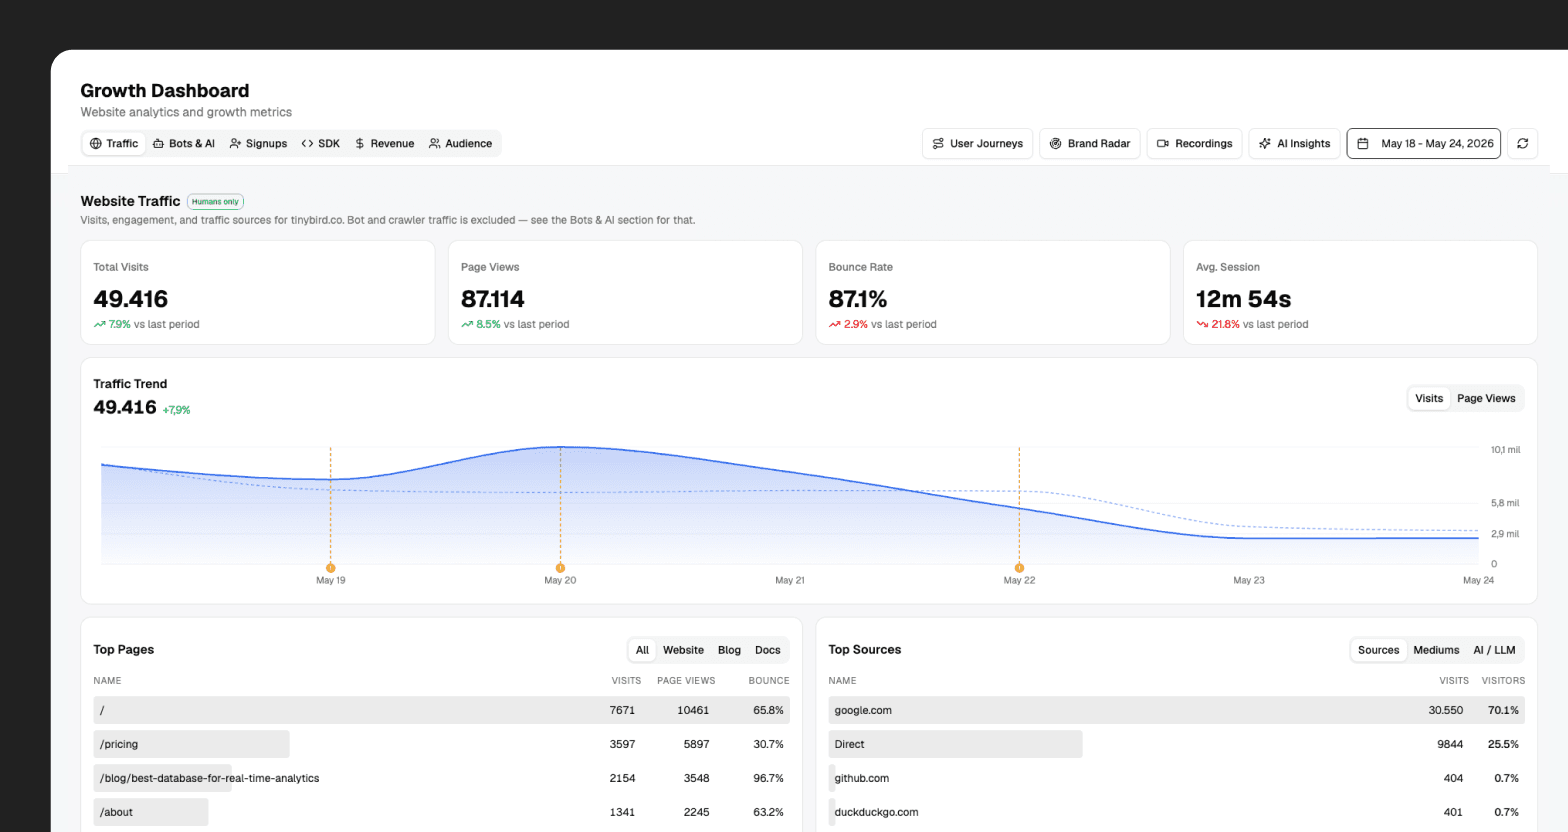
Birdwatcher growth dashboard
The main growth surface in Birdwatcher is /growth.
It covers three broad areas: traffic and acquisition, activation and product adoption, and revenue movement. So the same surface can connect where users came from with what they did during onboarding, which SDKs they picked, and whether that activity later showed up in plan movement.
This is not the first web analytics surface we have built with Tinybird. The public Web Analytics Starter Kit is already used by teams that want first-party traffic analytics, and we have written about the architecture behind its multitenant and AI features. Birdwatcher follows the same basic idea, but it sits next to Tinybird's internal product, billing, workspace, and support context.
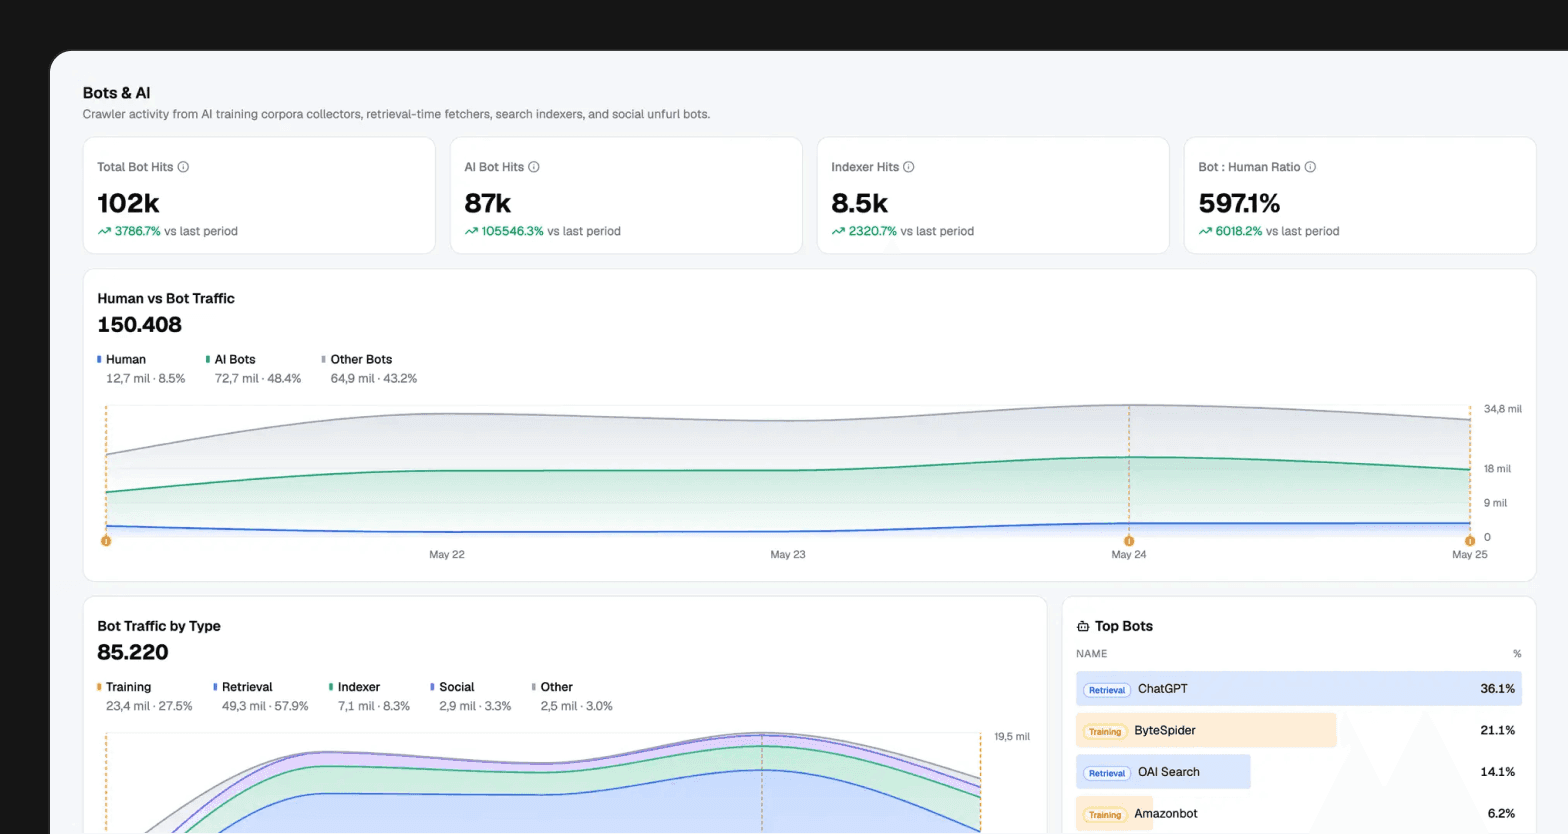
It also separates human traffic from bot traffic.
That separation matters more now than it did a few years ago. Client-side analytics does not see everything. Bots do not behave like humans. AI crawlers are now part of how technical content gets discovered and summarized. Treating those requests as normal users makes the dashboard worse.
So we model bot traffic explicitly. Search bots, AI crawlers, social bots, and human traffic are different views over the same web activity. The growth team can look at human acquisition without bot noise, then look at bot and AI traffic as its own category.
The same dashboard also exposes AI Insights over the visible data. AI Insights is a reusable summary layer in Birdwatcher: we send the context behind what someone is looking at, and it returns a summary grounded in that data.
Weekly growth reports now follow the same structure as the dashboard. The report is not a separate spreadsheet workflow. It is another consumer of the modeled data.
Session replay belongs next to events
Session replay was the clearest place where the old setup stopped making sense.
We had been consuming analytics data internally for a long time. We trusted it. We made decisions based on it. Support, customer success, billing, product, and platform teams already used internal Tinybird data every day. That data explained what was happening across accounts, workspaces, usage, errors, and billing.
At the same time, we had been building more charts and dashboards in PostHog. That worked until the questions kept pulling us back into internal data. If the chart needed our own workspace, billing, CLI, or support context, it was usually simpler to query Tinybird and build the view in Birdwatcher.
That left one important piece outside: session recordings.
When we wanted to see what a user actually experienced in the browser, we still had to leave Birdwatcher and open PostHog. Everything around the user lived internally, but the browser recording was elsewhere.
That was the wrong split. The recording was not useful because it was a video. It was useful because it explained behavior we were already seeing in internal data.
So we moved session recordings into Birdwatcher.
We wanted first-party recordings across our public and authenticated surfaces. More importantly, each recording needed to attach to the context Birdwatcher already knew: user, organization, workspace, product usage, billing, support, and the surrounding event timeline.
The implementation is straightforward in shape:
rrwebrecords the browser session.- A client package runs in the apps we care about.
- An ingest endpoint receives recording chunks.
- Chunks are compressed and stored in Tinybird.
- Recordings have a 30-day TTL.
- A materialized view groups chunks into visits.
- Birdwatcher renders the replay UI.
- Analytics events appear beside the recording as a timeline overlay.
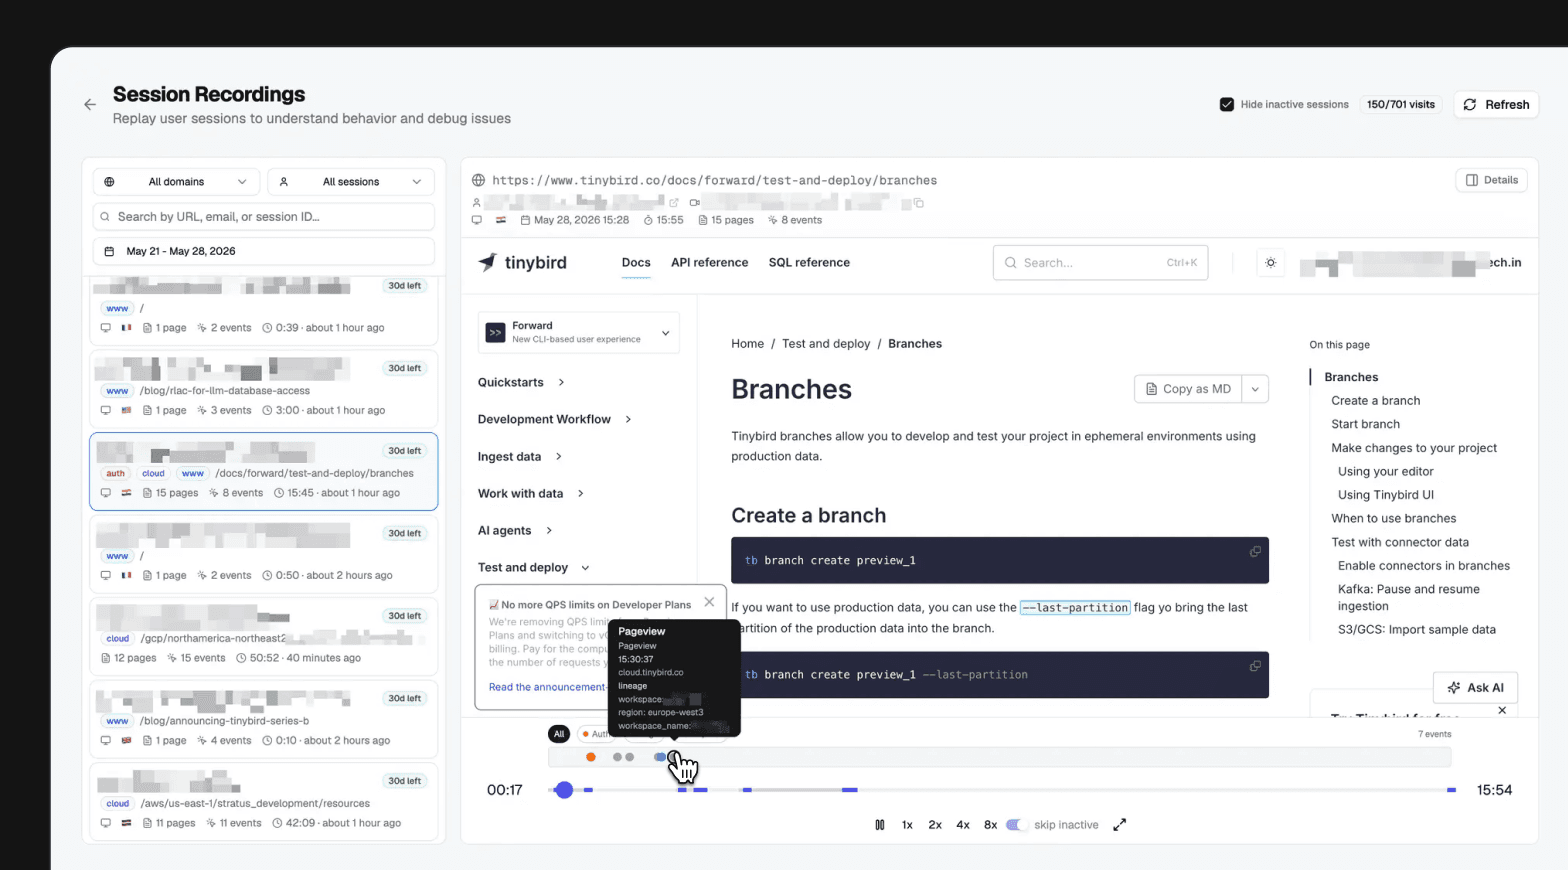
Replay on its own is useful. Replay joined with product and operational data is much more useful.
If a user hits an error, we can inspect the recording, the event timeline, and the operational context around it. If they sign up, we can connect the anonymous visit to the known user. If they later move deeper into the product, that path can be analyzed as one journey, including CLI activity, resource creation, deployments, and plan changes. Not a recording in one tool and the rest of the truth somewhere else.
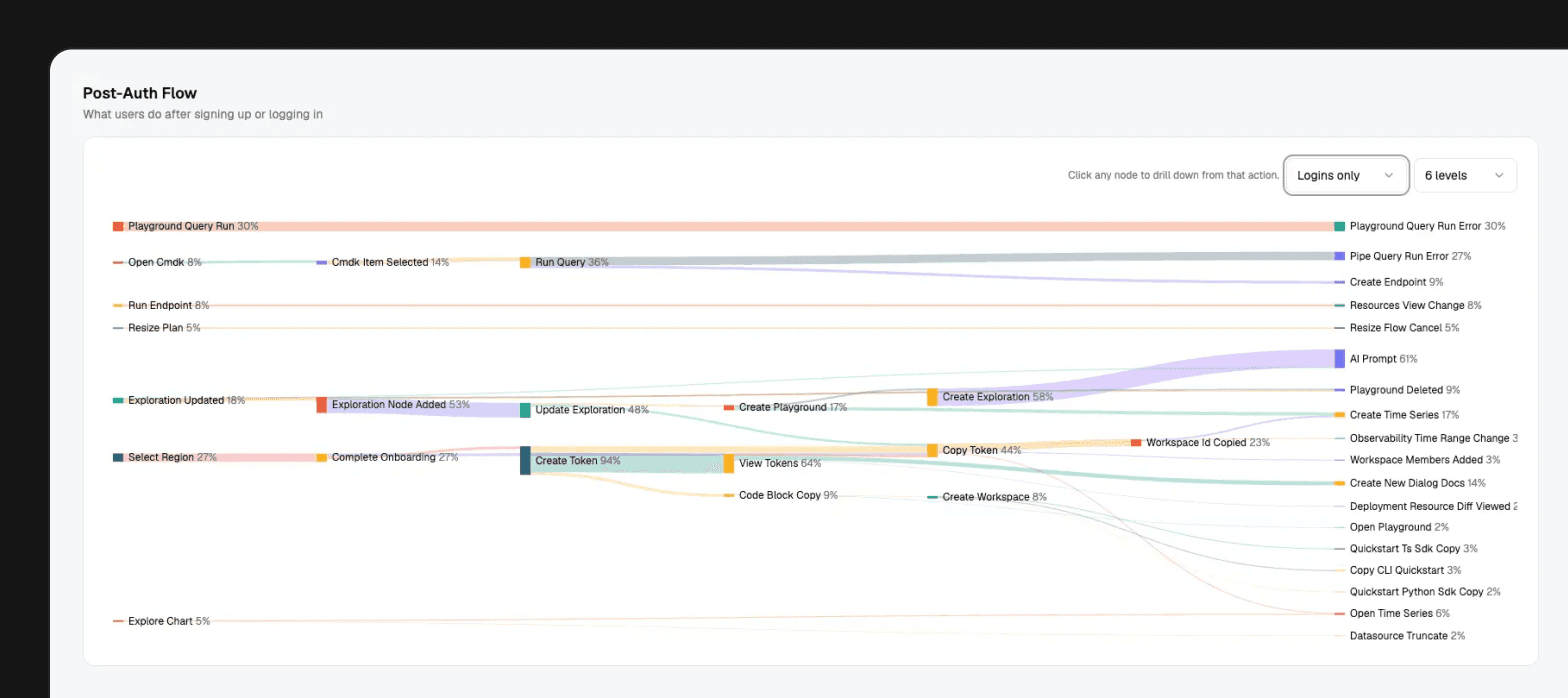
User journeys across website, product, CLI, and API
The useful unit is not a pageview. It is the path from first touch to product value.
Birdwatcher has a user journeys section for that.
At the aggregate level, it shows how people move before signup, after login, and into active usage. At the user level, it can follow a timeline from the public website and docs into product usage, CLI activity, API calls, and deployed Tinybird resources.
It also generates a user journey summary from structured data.
That detail matters. AI summaries are worse when you hand them a vague prompt and hope for insight. They get much better when the input is already modeled: ordered events, product actions, CLI commands, workspace context, and billing movement.
This is where owning the data loop starts to pay off. The question is no longer "how many people clicked this CTA?" It becomes "which paths led to product value, and what happened after the signup?"
Brand Radar and AI visibility as analytics problems
We also built Brand Radar inside Birdwatcher.
The original pressure was similar to what tools like Scrunch address: we wanted to understand whether LLMs mention Tinybird, how they describe us, which sources they cite, and how we compare with alternatives.
We did not build Brand Radar because we thought we could replace that category with a quick internal clone. We built it for our own learning. We wanted to understand the underlying behavior better: how different models answer, how prompts change the output, which sources shape the answer, and how people might ask LLMs about our category in the first place.
That meant shaping Brand Radar around useful internal questions, not just prompt analysis. It had to help us see how Tinybird shows up, but also how to ask better questions, how to evaluate the answers, and how to improve the context LLMs find about us.
The implementation is an analytics problem: run prompts across models, evaluate the responses, extract citations, classify sources, and track how mentions, sentiment, accuracy claims, and citations change over time.

AI bot traffic fits into the same idea. Which bots crawl our docs? Which pages do they hit? How often? What content gets cited later?
Answer Engine Optimization sounds like a new category, but the data pattern is familiar: define what to measure, collect the events, evaluate the output, and track the results over time. In practice, AI visibility became another modeled dataset in Birdwatcher.
Reports and the Slack agent
Dashboards are still useful. But a lot of company work starts somewhere else: a Slack question, a weekly update, a support thread, a POC, an incident, a customer call, or a growth review.
Birdwatcher now produces reports like daily signups, weekly growth, weekly migration, sales outreach, and MPM cadence. Some are static. Some are dynamic. Some use AI to turn the structured data into a narrative that can be posted in Slack. People use these reports as source material for daily meetings and ad hoc discussions.
The agent uses the same context. It can answer operational questions, read growth data, reuse validated queries, follow business rules, and learn from previous answers. People also ask it for SQL often, then use the generated query as a starting point in internal playgrounds and tweak it themselves.
That maps closely to how we think about AI agents in Tinybird: they are more useful when they can query trusted data, use known endpoints as tools, and operate with enough context to avoid guessing.
This is the part that made Birdwatcher feel less like a dashboard project and more like a company interface to product and platform data.
Different teams ask very different questions. A support question about a workspace, a growth question about signups, and a platform question about ingestion errors should not require three disconnected tools if the underlying data is already in the same place.
Birdwatcher is not owned by one team in a corner. Anyone can contribute, and we add features constantly as new internal questions show up.
What we learned
The obvious lesson is dogfooding. Many Tinybird customers use us to build analytics products. Using Tinybird for our own analytics product gives us a better feel for what works, what is missing, and where customers might struggle.
The more useful lessons are more specific:
- Owning the data makes joins possible. Growth analytics gets better when it can share context with support, billing, platform, and product data.
- Dashboards are not enough. They are necessary, but many people will not know which dashboard to open or what filter to use. Reports and agents matter because they bring the data into existing workflows.
- Session replay is better when it is joined with events. A recording with no product context is a video. A recording with an event timeline, user identity, workspace context, and later product actions is evidence.
- Bot traffic has to be modeled separately. AI crawlers, search bots, social bots, and humans should not be collapsed into one traffic number.
- AI visibility can be measured with the same patterns as product analytics. Prompts, responses, evaluations, citations, and run metadata are just data.
- AI summaries work better when they are fed structured data. The hard part is not asking the model to write a paragraph. The hard part is giving it the right data, the right definitions, and the right boundaries.
- A company data agent needs more than a SQL tool. It needs the same context a good internal analyst would use: what the tables mean, which business rules apply, which queries are safe, and what the system has already learned.
And we still use external tools where they make sense. This is not a purity test. The point is not that every SaaS tool should be rebuilt internally. The point is that duplicating internal operational truth into another analytics silo was the wrong default for us.
What comes next
Birdwatcher is internal and very tied to Tinybird's own data model.
That is the important constraint. It knows our product, workspaces, billing model, support patterns, internal vocabulary, and business logic.
So the useful next step is not packaging Birdwatcher as-is. It is separating the general patterns from the Tinybird-specific parts.
Those patterns are worth writing about in more detail: owning the data loop, putting recordings next to operational context, treating AI visibility as analytics, and making internal data usable through reports and agents.
For now, the important part is the shift we made internally: we stopped treating growth analytics as a separate silo and started treating it as another consumer of our operational data.
That changed the questions we could ask.