Notable fixes and improvements
- The "pulse" graph, the chart that displays real-time ingestion stats for every data source, is now also available for Materialized Views. This helps get a sense of how many rows are being materialized at any given time.
- We've introduced brushing for date range selection in the Time Series UI.
- Previously, when adding new columns to existing data sources in the UI, rows not containing them used to go into quarantine. Now, when new columns are added, the suggested type by default is 'Nullable(String)'.
- We've fixed an issue where a "Data Source not found" state would prevent you from closing the right panel for the Data Source preview view.
- Also fixed an issue that was causing the Data Source preview to close when hitting escape within the code editor.
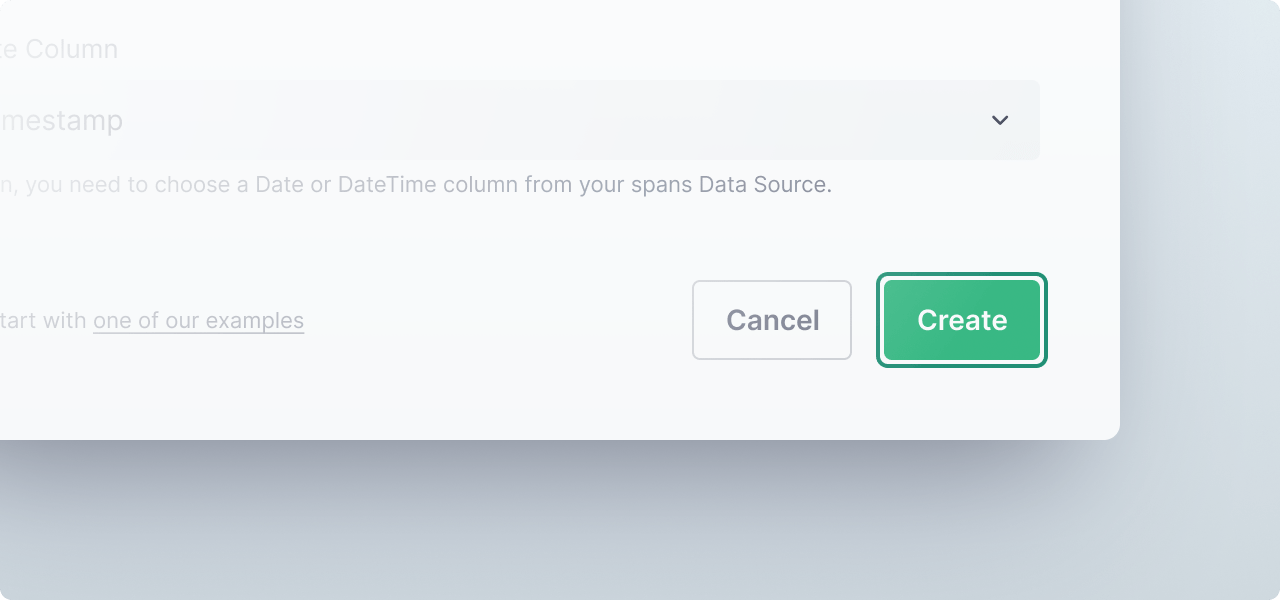
- Made all buttons highlight states consistent across the platform.